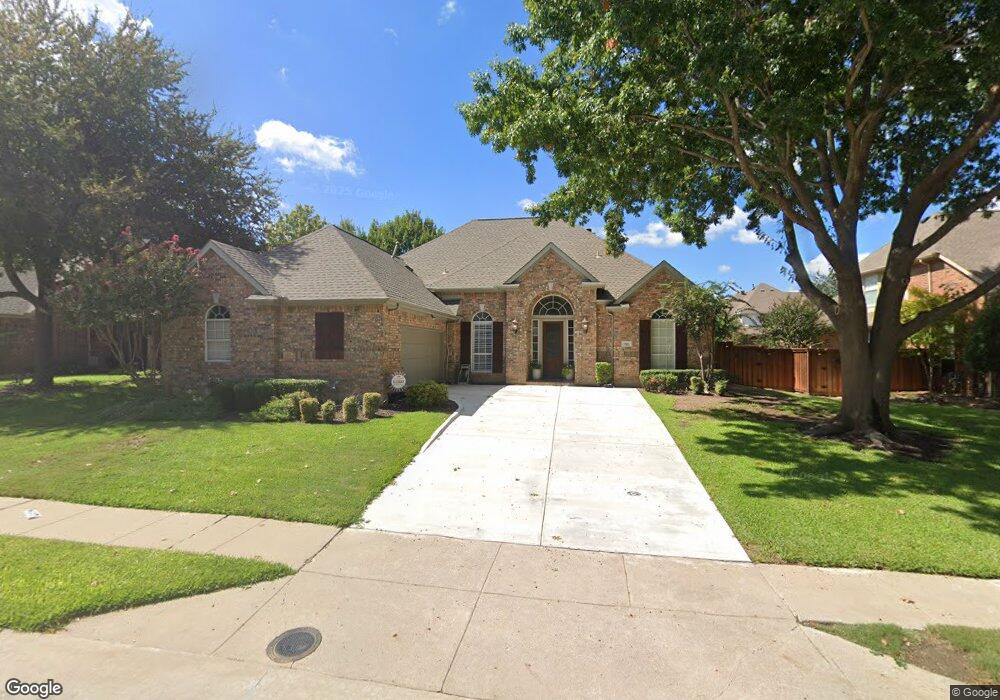
712 Coralberry Dr McKinney, TX 75070
Stonebridge Ranch NeighborhoodEstimated Value: $640,000 - $722,000
4
Beds
4
Baths
3,021
Sq Ft
$223/Sq Ft
Est. Value
About This Home
This home is located at 712 Coralberry Dr, McKinney, TX 75070 and is currently estimated at $673,705, approximately $223 per square foot. 712 Coralberry Dr is a home located in Collin County with nearby schools including C.T. Eddins Elementary School, Dowell Middle School, and McKinney Boyd High School.
Ownership History
Date
Name
Owned For
Owner Type
Purchase Details
Closed on
Apr 17, 2006
Sold by
Rh Of Texas Lp
Bought by
Yarbrough Shane C and Yarbrough Sarrah G
Current Estimated Value
Home Financials for this Owner
Home Financials are based on the most recent Mortgage that was taken out on this home.
Original Mortgage
$130,700
Interest Rate
6.58%
Mortgage Type
Purchase Money Mortgage
Purchase Details
Closed on
Apr 4, 2002
Sold by
Ewing Harvey P and Ewing Kristen L
Bought by
Kleman Christopher E and Kleman Natalie
Home Financials for this Owner
Home Financials are based on the most recent Mortgage that was taken out on this home.
Original Mortgage
$85,000
Interest Rate
6.78%
Purchase Details
Closed on
Mar 23, 2000
Sold by
Drees Custom Homes Lp
Bought by
Ewing Harvey P and Ewing Kristen L
Home Financials for this Owner
Home Financials are based on the most recent Mortgage that was taken out on this home.
Original Mortgage
$175,400
Interest Rate
8.37%
Create a Home Valuation Report for This Property
The Home Valuation Report is an in-depth analysis detailing your home's value as well as a comparison with similar homes in the area
Home Values in the Area
Average Home Value in this Area
Purchase History
| Date | Buyer | Sale Price | Title Company |
|---|---|---|---|
| Yarbrough Shane C | -- | Rtc | |
| Kleman Christopher E | -- | -- | |
| Ewing Harvey P | -- | -- |
Source: Public Records
Mortgage History
| Date | Status | Borrower | Loan Amount |
|---|---|---|---|
| Previous Owner | Yarbrough Shane C | $130,700 | |
| Previous Owner | Kleman Christopher E | $85,000 | |
| Previous Owner | Ewing Harvey P | $175,400 | |
| Closed | Ewing Harvey P | $35,080 |
Source: Public Records
Tax History Compared to Growth
Tax History
| Year | Tax Paid | Tax Assessment Tax Assessment Total Assessment is a certain percentage of the fair market value that is determined by local assessors to be the total taxable value of land and additions on the property. | Land | Improvement |
|---|---|---|---|---|
| 2025 | $11,957 | $652,227 | $140,000 | $537,294 |
| 2024 | $11,957 | $592,934 | $140,000 | $535,066 |
| 2023 | $11,957 | $539,031 | $140,000 | $515,581 |
| 2022 | $9,820 | $490,028 | $140,000 | $466,925 |
| 2021 | $9,460 | $445,480 | $105,000 | $340,480 |
| 2020 | $9,963 | $440,799 | $85,000 | $355,799 |
| 2019 | $10,507 | $442,006 | $85,000 | $357,006 |
| 2018 | $10,151 | $417,341 | $85,000 | $332,341 |
| 2017 | $9,831 | $404,189 | $75,000 | $329,189 |
| 2016 | $9,415 | $395,689 | $70,000 | $325,689 |
| 2015 | $8,030 | $344,765 | $65,000 | $279,765 |
Source: Public Records
Map
Nearby Homes
- 801 Hackberry Ridge Dr
- 8401 Beech Ln
- 8209 Old Hickory Ln
- 804 Woodcliff Dr
- 905 Bristlewood Dr
- 8801 Falcon Crest Dr
- 512 Audubon Dr
- 1200 Pecan Valley Dr
- 1305 Canyon Creek Dr
- 8708 Tanglewood Dr
- 7900 Linksview Dr
- 304 Sparrow Hawk
- 7808 Linksview Dr
- 9104 Garden Grove Dr
- 8601 Tanglewood Dr
- 501 Clear Springs Ct
- 8443 Spectrum Dr
- 7604 Hilton Head Dr
- 201 Mapleshade Dr
- 8905 Glen Garden Dr
- 708 Coralberry Dr
- 800 Coralberry Dr
- 709 Crabapple Way
- 705 Crabapple Way
- 713 Crabapple Way
- 804 Coralberry Dr
- 704 Coralberry Dr
- 713 Coralberry Dr
- 801 Coralberry Dr
- 709 Coralberry Dr
- 701 Crabapple Way
- 805 Coralberry Dr
- 808 Coralberry Dr
- 717 Crabapple Way
- 705 Coralberry Dr
- 809 Coralberry Dr
- 628 Hackberry Ridge Dr
- 700 Hackberry Ridge Dr
- 8408 Forsythia Dr
- 813 Coralberry Dr