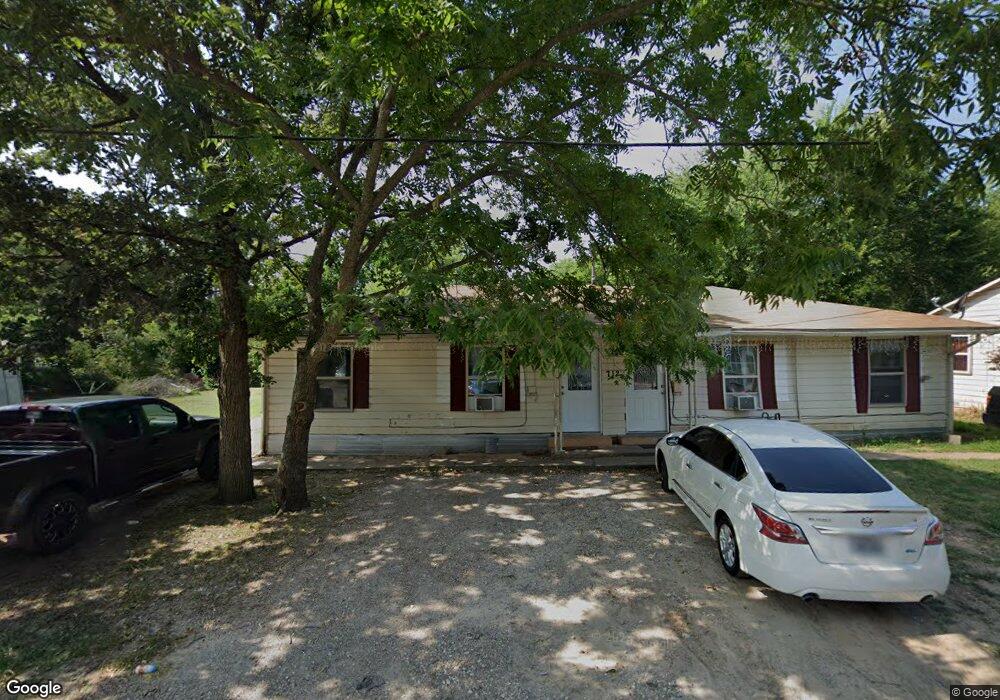
712 E 11th St Bonham, TX 75418
Estimated Value: $159,000 - $198,000
3
Beds
2
Baths
1,248
Sq Ft
$137/Sq Ft
Est. Value
About This Home
This home is located at 712 E 11th St, Bonham, TX 75418 and is currently estimated at $171,582, approximately $137 per square foot. 712 E 11th St is a home located in Fannin County with nearby schools including Evans Elementary School, Finley-Oates Elementary School, and LH Rather Jr High School.
Ownership History
Date
Name
Owned For
Owner Type
Purchase Details
Closed on
Oct 30, 2020
Sold by
Hernandez Juan
Bought by
Sanchez Suyapa Argentina Sandoval
Current Estimated Value
Purchase Details
Closed on
Nov 7, 2016
Sold by
Herrington David
Bought by
Sanchez Suyapa Argentina Sandoval
Purchase Details
Closed on
Jun 2, 2016
Sold by
Harrell Linda Fitzwater
Bought by
Herrington David
Create a Home Valuation Report for This Property
The Home Valuation Report is an in-depth analysis detailing your home's value as well as a comparison with similar homes in the area
Purchase History
| Date | Buyer | Sale Price | Title Company |
|---|---|---|---|
| Sanchez Suyapa Argentina Sandoval | -- | Cole Title Co | |
| Sanchez Suyapa Argentina Sandoval | -- | None Available | |
| Herrington David | -- | None Available |
Source: Public Records
Tax History
| Year | Tax Paid | Tax Assessment Tax Assessment Total Assessment is a certain percentage of the fair market value that is determined by local assessors to be the total taxable value of land and additions on the property. | Land | Improvement |
|---|---|---|---|---|
| 2025 | $2,315 | $119,370 | $35,190 | $84,180 |
| 2024 | $2,597 | $133,910 | $35,010 | $98,900 |
| 2023 | $2,343 | $118,840 | $22,150 | $96,690 |
| 2022 | $2,458 | $111,780 | $16,340 | $95,440 |
| 2021 | $1,231 | $48,720 | $8,480 | $40,240 |
| 2020 | $1,051 | $41,120 | $5,920 | $35,200 |
| 2019 | $1,124 | $42,290 | $5,810 | $36,480 |
| 2018 | $948 | $35,710 | $5,750 | $29,960 |
| 2017 | $751 | $29,380 | $3,020 | $26,360 |
| 2016 | $667 | $26,110 | $3,330 | $22,780 |
| 2015 | -- | $24,540 | $3,200 | $21,340 |
| 2014 | -- | $23,820 | $2,610 | $21,210 |
Source: Public Records
Map
Nearby Homes
Your Personal Tour Guide
Ask me questions while you tour the home.