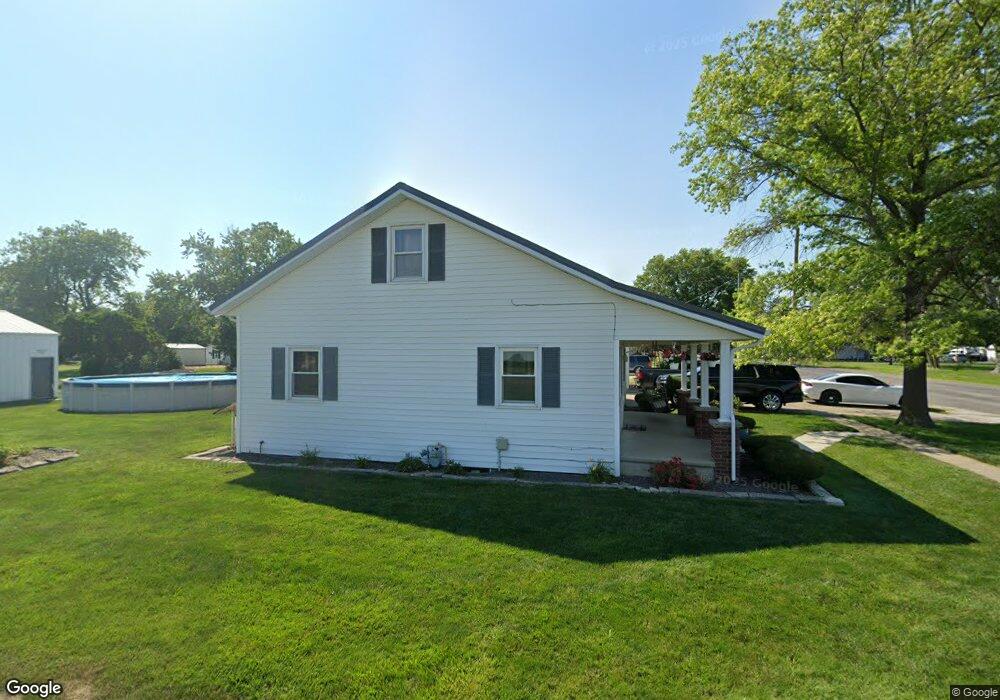
712 E Broad St Raymond, IL 62560
Estimated Value: $126,985 - $140,000
2
Beds
1
Bath
1,125
Sq Ft
$117/Sq Ft
Est. Value
About This Home
This home is located at 712 E Broad St, Raymond, IL 62560 and is currently estimated at $131,746, approximately $117 per square foot. 712 E Broad St is a home located in Montgomery County with nearby schools including Farmersville Grade School, Raymond Grade School, and Lincolnwood Junior High School.
Ownership History
Date
Name
Owned For
Owner Type
Purchase Details
Closed on
Feb 26, 2010
Sold by
Byle Paul M and Harmon Sallie L
Bought by
Waterman Montgomery D
Current Estimated Value
Home Financials for this Owner
Home Financials are based on the most recent Mortgage that was taken out on this home.
Original Mortgage
$76,500
Outstanding Balance
$50,779
Interest Rate
5.01%
Mortgage Type
New Conventional
Estimated Equity
$80,967
Purchase Details
Closed on
Jul 27, 2006
Sold by
Mizera Timothy J and Mizera Mary L
Bought by
Mizera Timothy J and Mizera Mary L
Home Financials for this Owner
Home Financials are based on the most recent Mortgage that was taken out on this home.
Original Mortgage
$76,000
Interest Rate
1.75%
Mortgage Type
New Conventional
Purchase Details
Closed on
Aug 20, 2005
Sold by
Mizera Timothy J and Ziera Mary L
Bought by
Byle Paul M and Harmon Sallie L
Home Financials for this Owner
Home Financials are based on the most recent Mortgage that was taken out on this home.
Original Mortgage
$71,460
Interest Rate
6.54%
Mortgage Type
New Conventional
Create a Home Valuation Report for This Property
The Home Valuation Report is an in-depth analysis detailing your home's value as well as a comparison with similar homes in the area
Purchase History
| Date | Buyer | Sale Price | Title Company |
|---|---|---|---|
| Waterman Montgomery D | $74,500 | None Available | |
| Mizera Timothy J | -- | Keevin Title Services | |
| Byle Paul M | $70,500 | None Available |
Source: Public Records
Mortgage History
| Date | Status | Borrower | Loan Amount |
|---|---|---|---|
| Open | Waterman Montgomery D | $76,500 | |
| Previous Owner | Mizera Timothy J | $76,000 | |
| Previous Owner | Byle Paul M | $71,460 |
Source: Public Records
Tax History
| Year | Tax Paid | Tax Assessment Tax Assessment Total Assessment is a certain percentage of the fair market value that is determined by local assessors to be the total taxable value of land and additions on the property. | Land | Improvement |
|---|---|---|---|---|
| 2024 | -- | $47,190 | $3,530 | $43,660 |
| 2023 | -- | $43,950 | $3,290 | $40,660 |
| 2022 | $0 | $41,330 | $3,090 | $38,240 |
| 2021 | $1,932 | $38,830 | $2,900 | $35,930 |
| 2020 | $1,932 | $36,520 | $2,730 | $33,790 |
| 2019 | $1,932 | $34,890 | $2,610 | $32,280 |
| 2018 | $0 | $32,970 | $2,470 | $30,500 |
| 2017 | $0 | $27,740 | $2,400 | $25,340 |
| 2016 | $0 | $27,120 | $2,350 | $24,770 |
| 2015 | $1,932 | $26,940 | $2,330 | $24,610 |
| 2013 | $1,910 | $26,560 | $2,300 | $24,260 |
Source: Public Records
Map
Nearby Homes
- 206 N Oak St
- 108 E Jaeger St
- 109 N School St
- 7076 Oak Ave
- 7067 Oak Ave
- 322 Main St
- 17251 Illinois 127
- 10 Weeks Ln
- 10 Day Spring
- 107 Weeks Ln
- 1 Eagle Ridge Dr
- 7 Forest Ridge Ln
- 4 Forest Ridge Ln
- 8 Forest Ridge Ln
- 3 Forest Ridge Ln
- TBD Forest Ridge Ln
- 21 Lake Pointe Ln
- 20 Lake Pointe Ln
- 36 Timber Ridge Dr
- 38 Maplewood Ct
Your Personal Tour Guide
Ask me questions while you tour the home.