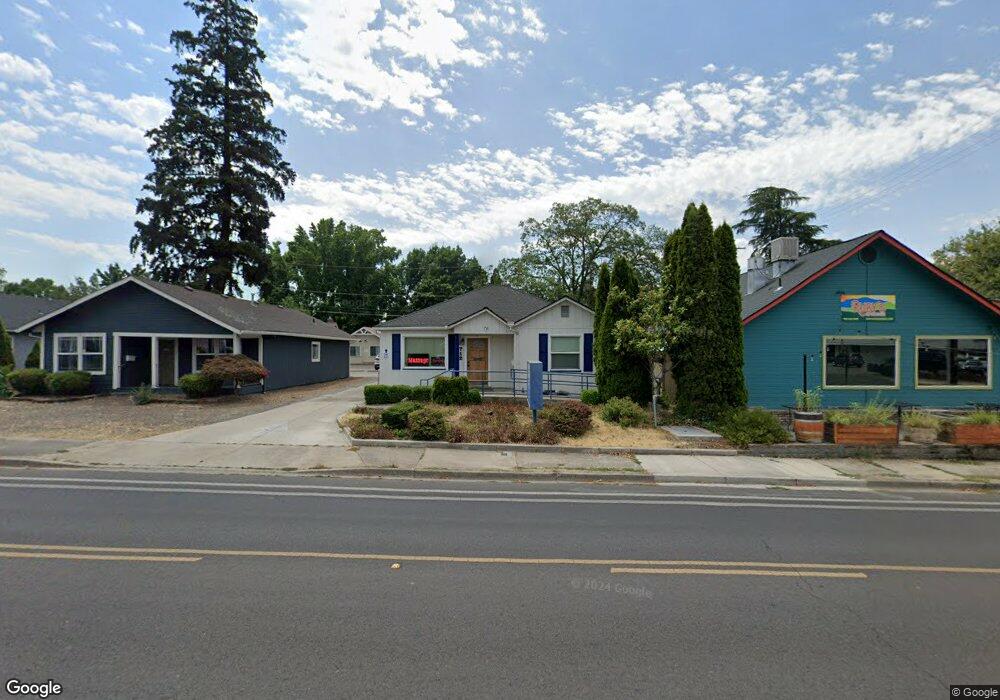
712 E Jackson St Medford, OR 97504
Estimated Value: $365,565
Studio
--
Bath
1,448
Sq Ft
$252/Sq Ft
Est. Value
About This Home
This home is located at 712 E Jackson St, Medford, OR 97504 and is currently estimated at $365,565, approximately $252 per square foot. 712 E Jackson St is a home located in Jackson County with nearby schools including Roosevelt Elementary School, Hedrick Middle School, and South Medford High School.
Ownership History
Date
Name
Owned For
Owner Type
Purchase Details
Closed on
Jan 23, 2018
Sold by
Noon Bldg 1 Llc
Bought by
Maloof Nasif Bradley
Current Estimated Value
Home Financials for this Owner
Home Financials are based on the most recent Mortgage that was taken out on this home.
Original Mortgage
$100,000
Interest Rate
3.93%
Mortgage Type
New Conventional
Purchase Details
Closed on
Sep 17, 2010
Sold by
Noon Duane
Bought by
Noon Bldg 1 Llc
Purchase Details
Closed on
Oct 9, 2008
Sold by
R & B Resources Llc
Bought by
Noon Duane
Home Financials for this Owner
Home Financials are based on the most recent Mortgage that was taken out on this home.
Original Mortgage
$190,000
Interest Rate
6.39%
Mortgage Type
Commercial
Purchase Details
Closed on
Jan 16, 1998
Sold by
Perry C William and Perry Robyn R
Bought by
R B Resources Llc
Create a Home Valuation Report for This Property
The Home Valuation Report is an in-depth analysis detailing your home's value as well as a comparison with similar homes in the area
Purchase History
| Date | Buyer | Sale Price | Title Company |
|---|---|---|---|
| Maloof Nasif Bradley | $250,000 | Ticor Title | |
| Noon Bldg 1 Llc | -- | None Available | |
| Noon Duane | $240,000 | Lawyers Title Ins | |
| R B Resources Llc | -- | -- |
Source: Public Records
Mortgage History
| Date | Status | Borrower | Loan Amount |
|---|---|---|---|
| Closed | Maloof Nasif Bradley | $100,000 | |
| Previous Owner | Noon Duane | $190,000 |
Source: Public Records
Tax History
| Year | Tax Paid | Tax Assessment Tax Assessment Total Assessment is a certain percentage of the fair market value that is determined by local assessors to be the total taxable value of land and additions on the property. | Land | Improvement |
|---|---|---|---|---|
| 2026 | $2,346 | $163,140 | -- | -- |
| 2025 | $2,297 | $158,390 | $91,550 | $66,840 |
| 2024 | $2,297 | $153,780 | $88,880 | $64,900 |
| 2023 | $2,227 | $149,310 | $86,290 | $63,020 |
| 2022 | $2,173 | $149,310 | $86,290 | $63,020 |
| 2021 | $2,116 | $144,970 | $83,780 | $61,190 |
| 2020 | $2,072 | $140,750 | $81,340 | $59,410 |
| 2019 | $2,023 | $132,680 | $76,670 | $56,010 |
| 2018 | $1,971 | $128,820 | $74,440 | $54,380 |
| 2017 | $1,935 | $128,820 | $74,440 | $54,380 |
| 2016 | $1,948 | $121,430 | $70,170 | $51,260 |
| 2015 | $1,873 | $121,430 | $70,170 | $51,260 |
| 2014 | $1,840 | $114,470 | $66,150 | $48,320 |
Source: Public Records
Map
Nearby Homes
- 719 Bennett Ave
- 214 Stark St
- 619 E Main St
- 27 Crater Lake Ave
- 737 Stevens St Unit 103
- 503 Mae St
- 108 Cottage St
- 408 Marie St
- 1116 Reddy Ave
- 813 E 9th St
- 112 Vancouver Ave
- 1111 Stevens St Unit 20
- 858 E 9th St
- 821 E 10th St
- 122 Willamette Ave
- 824 N Riverside Ave
- 1320 E Main St
- 799 Spring St
- 528 Pearl St
- 1503 E Main St
- 714 E Jackson St
- 716 E Jackson St
- 703 Sherman St
- 707 Sherman St
- 711 Sherman St
- 720 E Jackson St
- 701 E Jackson St
- 713 E Jackson St
- 717 Sherman St
- 303 Genessee St
- 717 E Jackson St
- 723 Sherman St
- 625 E Jackson St Unit A
- 625 E Jackson St Unit C
- 625 E Jackson St
- 625 E Jackson St Unit B
- 721 E Jackson St
- 800 E Jackson St
- 803 Sherman St
- 613 E Jackson St
Your Personal Tour Guide
Ask me questions while you tour the home.