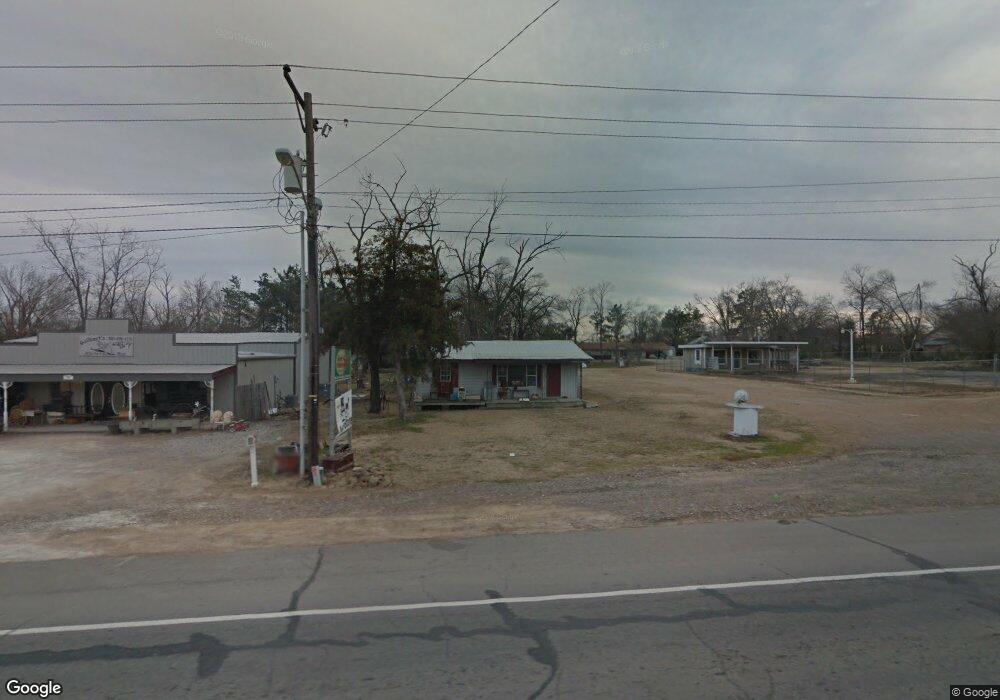
712 E Main St Unit Lots 8 & 9 Antlers, OK 74523
Estimated Value: $48,919 - $86,000
2
Beds
1
Bath
960
Sq Ft
$77/Sq Ft
Est. Value
About This Home
This home is located at 712 E Main St Unit Lots 8 & 9, Antlers, OK 74523 and is currently estimated at $73,480, approximately $76 per square foot. 712 E Main St Unit Lots 8 & 9 is a home located in Pushmataha County with nearby schools including Brantly Elementary School, Obuch Middle School, and Antlers High School.
Ownership History
Date
Name
Owned For
Owner Type
Purchase Details
Closed on
Oct 18, 2023
Sold by
Gay Delbert W and Gay Patricia G
Bought by
Martin David
Current Estimated Value
Home Financials for this Owner
Home Financials are based on the most recent Mortgage that was taken out on this home.
Original Mortgage
$230,049
Outstanding Balance
$193,711
Interest Rate
6.91%
Mortgage Type
Construction
Estimated Equity
-$120,231
Purchase Details
Closed on
Aug 8, 2008
Sold by
Rymel Sammy Joe
Bought by
Gay Delbert
Create a Home Valuation Report for This Property
The Home Valuation Report is an in-depth analysis detailing your home's value as well as a comparison with similar homes in the area
Purchase History
| Date | Buyer | Sale Price | Title Company |
|---|---|---|---|
| Martin David | $240,000 | -- | |
| Gay Delbert | $30,000 | -- |
Source: Public Records
Mortgage History
| Date | Status | Borrower | Loan Amount |
|---|---|---|---|
| Open | Martin David | $230,049 |
Source: Public Records
Tax History
| Year | Tax Paid | Tax Assessment Tax Assessment Total Assessment is a certain percentage of the fair market value that is determined by local assessors to be the total taxable value of land and additions on the property. | Land | Improvement |
|---|---|---|---|---|
| 2025 | $118 | $1,613 | $550 | $1,063 |
| 2024 | $124 | $1,700 | $550 | $1,150 |
| 2023 | $168 | $2,298 | $550 | $1,748 |
| 2022 | $160 | $2,189 | $550 | $1,639 |
| 2021 | $161 | $2,189 | $550 | $1,639 |
| 2020 | $161 | $2,189 | $550 | $1,639 |
| 2019 | $161 | $2,189 | $550 | $1,639 |
| 2018 | $161 | $2,189 | $550 | $1,639 |
| 2017 | $161 | $2,189 | $550 | $1,639 |
| 2016 | $154 | $2,095 | $550 | $1,545 |
| 2015 | $147 | $1,995 | $550 | $1,445 |
| 2014 | $244 | $3,314 | $1,110 | $2,204 |
Source: Public Records
Map
Nearby Homes
Your Personal Tour Guide
Ask me questions while you tour the home.