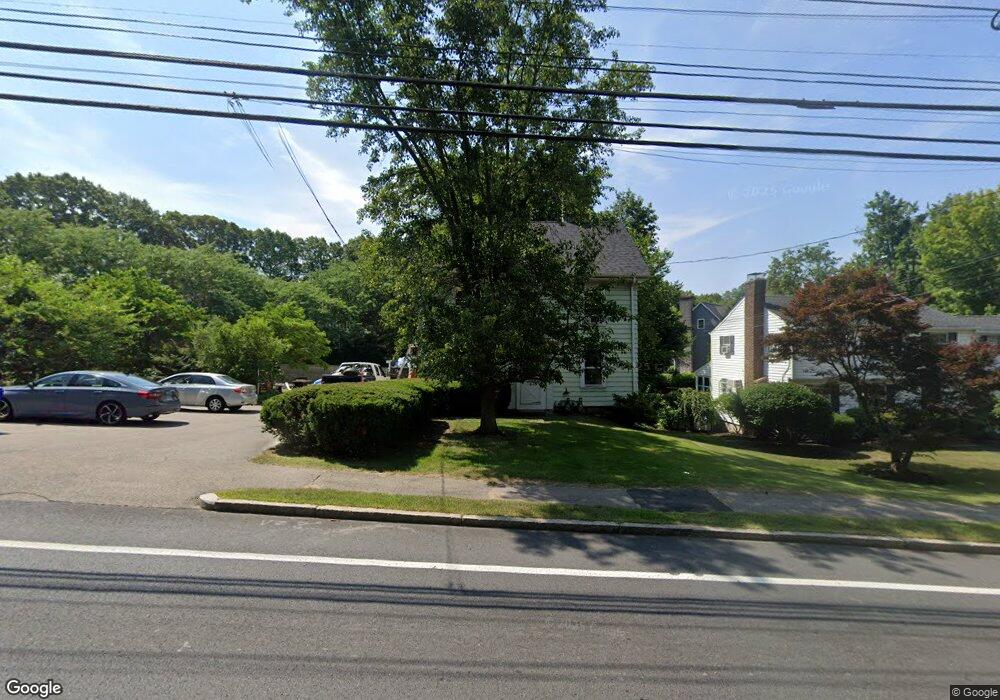
712 East St Walpole, MA 02081
Estimated Value: $727,000 - $799,000
3
Beds
2
Baths
1,200
Sq Ft
$628/Sq Ft
Est. Value
About This Home
This home is located at 712 East St, Walpole, MA 02081 and is currently estimated at $753,818, approximately $628 per square foot. 712 East St is a home located in Norfolk County with nearby schools including Fisher School, Walpole Middle School, and Walpole High School.
Ownership History
Date
Name
Owned For
Owner Type
Purchase Details
Closed on
Sep 30, 2024
Sold by
Jackson Christopher W
Bought by
Williams Michael
Current Estimated Value
Home Financials for this Owner
Home Financials are based on the most recent Mortgage that was taken out on this home.
Original Mortgage
$662,150
Outstanding Balance
$654,095
Interest Rate
6.49%
Mortgage Type
Purchase Money Mortgage
Estimated Equity
$99,723
Purchase Details
Closed on
Jun 5, 2020
Sold by
Jackson Christopher W and Jackson Katie
Bought by
Jackson Christopher W
Home Financials for this Owner
Home Financials are based on the most recent Mortgage that was taken out on this home.
Original Mortgage
$305,000
Interest Rate
3.2%
Mortgage Type
New Conventional
Purchase Details
Closed on
Aug 29, 2008
Sold by
Ryan Donna M and Ryan Richard R
Bought by
Jackson Christopher W and Jackson Katie
Home Financials for this Owner
Home Financials are based on the most recent Mortgage that was taken out on this home.
Original Mortgage
$340,200
Interest Rate
6.29%
Mortgage Type
Purchase Money Mortgage
Create a Home Valuation Report for This Property
The Home Valuation Report is an in-depth analysis detailing your home's value as well as a comparison with similar homes in the area
Home Values in the Area
Average Home Value in this Area
Purchase History
| Date | Buyer | Sale Price | Title Company |
|---|---|---|---|
| Williams Michael | $697,000 | None Available | |
| Jackson Christopher W | -- | None Available | |
| Jackson Christopher W | -- | None Available | |
| Jackson Christopher W | -- | None Available | |
| Jackson Christopher W | $356,000 | -- | |
| Jackson Christopher W | $356,000 | -- | |
| Jackson Christopher W | $356,000 | -- |
Source: Public Records
Mortgage History
| Date | Status | Borrower | Loan Amount |
|---|---|---|---|
| Open | Williams Michael | $662,150 | |
| Previous Owner | Jackson Christopher W | $305,000 | |
| Previous Owner | Jackson Christopher W | $340,294 | |
| Previous Owner | Jackson Christopher W | $349,287 | |
| Previous Owner | Jackson Christopher W | $340,200 |
Source: Public Records
Tax History Compared to Growth
Tax History
| Year | Tax Paid | Tax Assessment Tax Assessment Total Assessment is a certain percentage of the fair market value that is determined by local assessors to be the total taxable value of land and additions on the property. | Land | Improvement |
|---|---|---|---|---|
| 2025 | $7,168 | $558,700 | $276,200 | $282,500 |
| 2024 | $7,231 | $547,000 | $265,500 | $281,500 |
| 2023 | $7,237 | $521,000 | $230,900 | $290,100 |
| 2022 | $6,744 | $466,400 | $213,800 | $252,600 |
| 2021 | $6,380 | $429,900 | $201,700 | $228,200 |
| 2020 | $6,011 | $401,000 | $180,300 | $220,700 |
| 2019 | $5,515 | $365,200 | $173,400 | $191,800 |
| 2018 | $5,106 | $334,400 | $157,800 | $176,600 |
| 2017 | $4,972 | $324,300 | $151,700 | $172,600 |
| 2016 | $4,856 | $312,100 | $154,400 | $157,700 |
| 2015 | $4,503 | $286,800 | $130,600 | $156,200 |
| 2014 | $4,306 | $273,200 | $130,600 | $142,600 |
Source: Public Records
Map
Nearby Homes
- 4403 Pennington Dr Unit 4403
- 2213 Pennington Dr Unit 2213
- 8 Rainbow Pond Dr Unit 8
- 305 Centre Ln
- 103 Centre Ln
- 224 School St Unit 10
- 52 Baker St
- 21 Spear Ave
- 2 Alexandra Way
- 634 Main St Unit 14
- 486 Washington St
- 291 Plimpton St
- 145 South St Unit 5
- 145 South St Unit 19
- 1156 Washington St
- 363 - 367 Washington St
- 66 Gould St
- 8 Autumn Ln
- 66 Oak St
- 1 Palace Ct
- 712 East St
- 712 East St Unit 1
- 712 East St Unit 2
- 716 East St
- Lot 614 East St
- 720 East St
- 700 East St Unit P
- 700 East St Unit O
- 700 East St Unit N
- 700 East St Unit M
- 700 East St Unit L
- 700 East St Unit K
- 700 East St Unit J
- 700 East St Unit I
- 700 East St Unit H
- 700 East St Unit G
- 700 East St Unit F
- 700 East St Unit E
- 700 East St Unit D
- 700 East St Unit C