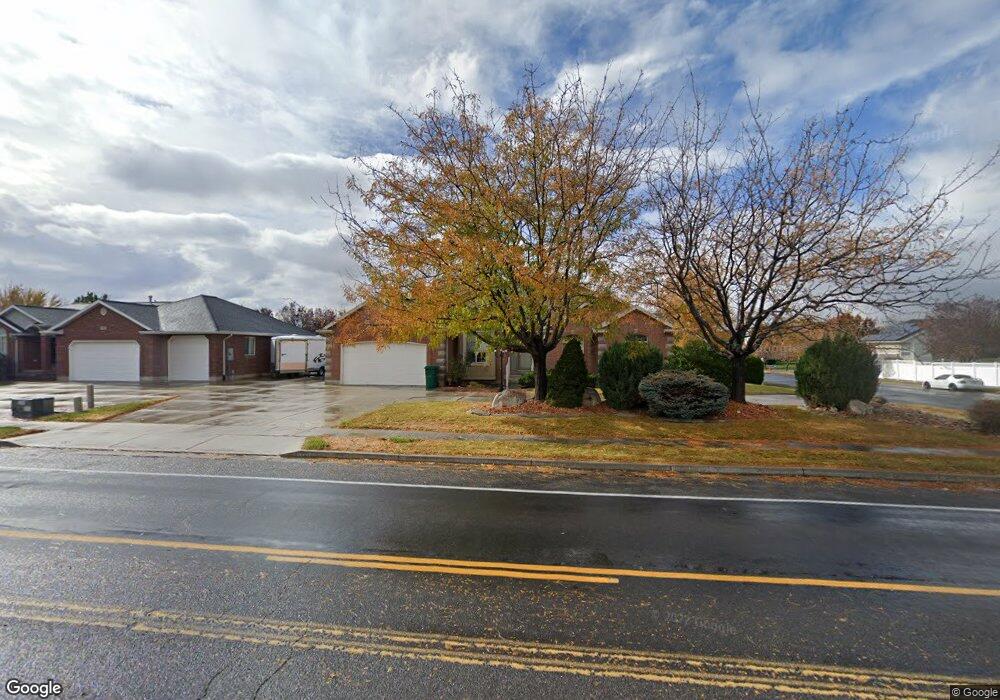
712 Flint St Layton, UT 84041
Estimated Value: $510,000 - $644,277
2
Beds
2
Baths
1,799
Sq Ft
$324/Sq Ft
Est. Value
About This Home
This home is located at 712 Flint St, Layton, UT 84041 and is currently estimated at $583,069, approximately $324 per square foot. 712 Flint St is a home located in Davis County with nearby schools including Layton Elementary School, Fairfield Junior High School, and Davis High School.
Ownership History
Date
Name
Owned For
Owner Type
Purchase Details
Closed on
Sep 8, 2003
Sold by
Freeport Food Mart Corp #1 and Gardner Phil C
Bought by
Gardner Lynda S
Current Estimated Value
Purchase Details
Closed on
Nov 14, 2002
Sold by
Cottrell Ralph Layton and Cottrell Patricia Ann
Bought by
Freeport Food Mart Corp #1 and Gardner Phil C
Purchase Details
Closed on
Dec 11, 2001
Sold by
L Dale Green Construction Inc
Bought by
Cottrell Ralph Layton and Cottrell Patricia Ann
Purchase Details
Closed on
Jun 13, 2001
Sold by
Green & Green Lc
Bought by
L Dale Green Construction Inc
Home Financials for this Owner
Home Financials are based on the most recent Mortgage that was taken out on this home.
Original Mortgage
$163,200
Interest Rate
7.14%
Mortgage Type
Construction
Create a Home Valuation Report for This Property
The Home Valuation Report is an in-depth analysis detailing your home's value as well as a comparison with similar homes in the area
Home Values in the Area
Average Home Value in this Area
Purchase History
| Date | Buyer | Sale Price | Title Company |
|---|---|---|---|
| Gardner Lynda S | -- | -- | |
| Freeport Food Mart Corp #1 | -- | Heritage West Title Insuranc | |
| Cottrell Ralph Layton | -- | Security Title Company | |
| L Dale Green Construction Inc | -- | Security Title Company |
Source: Public Records
Mortgage History
| Date | Status | Borrower | Loan Amount |
|---|---|---|---|
| Previous Owner | L Dale Green Construction Inc | $163,200 |
Source: Public Records
Tax History Compared to Growth
Tax History
| Year | Tax Paid | Tax Assessment Tax Assessment Total Assessment is a certain percentage of the fair market value that is determined by local assessors to be the total taxable value of land and additions on the property. | Land | Improvement |
|---|---|---|---|---|
| 2025 | $2,814 | $315,150 | $124,132 | $191,018 |
| 2024 | $2,814 | $297,550 | $133,154 | $164,396 |
| 2023 | $2,833 | $528,000 | $140,214 | $387,786 |
| 2022 | $3,092 | $312,950 | $81,996 | $230,954 |
| 2021 | $2,676 | $404,000 | $122,978 | $281,022 |
| 2020 | $2,431 | $352,000 | $104,965 | $247,035 |
| 2019 | $2,376 | $337,000 | $104,038 | $232,962 |
| 2018 | $2,170 | $309,000 | $91,650 | $217,350 |
| 2016 | $2,276 | $167,200 | $37,810 | $129,390 |
| 2015 | $2,254 | $157,190 | $37,810 | $119,380 |
| 2014 | $2,279 | $162,487 | $37,810 | $124,677 |
| 2013 | -- | $142,472 | $38,003 | $104,469 |
Source: Public Records
Map
Nearby Homes
- 268 E 900 S
- 282 E 925 S
- 267 S Melody St
- 774 W Farming Way
- 174 W Dawson St
- 562 S 850 W
- 473 E Alice Way
- 493 E Alice Way
- 256 Seemore Dr
- 2056 W Phillips St
- 1038 S Old Towne Rd
- 355 W Gentile St
- 1429 W Lincoln Way
- 356 W 25 N
- 593 Kimball Dr
- 362 S 950 W
- 714 Rose Blossom Dr
- 1042 W Shoreline Dr
- 617 E 405 S
- 296 S 950 W