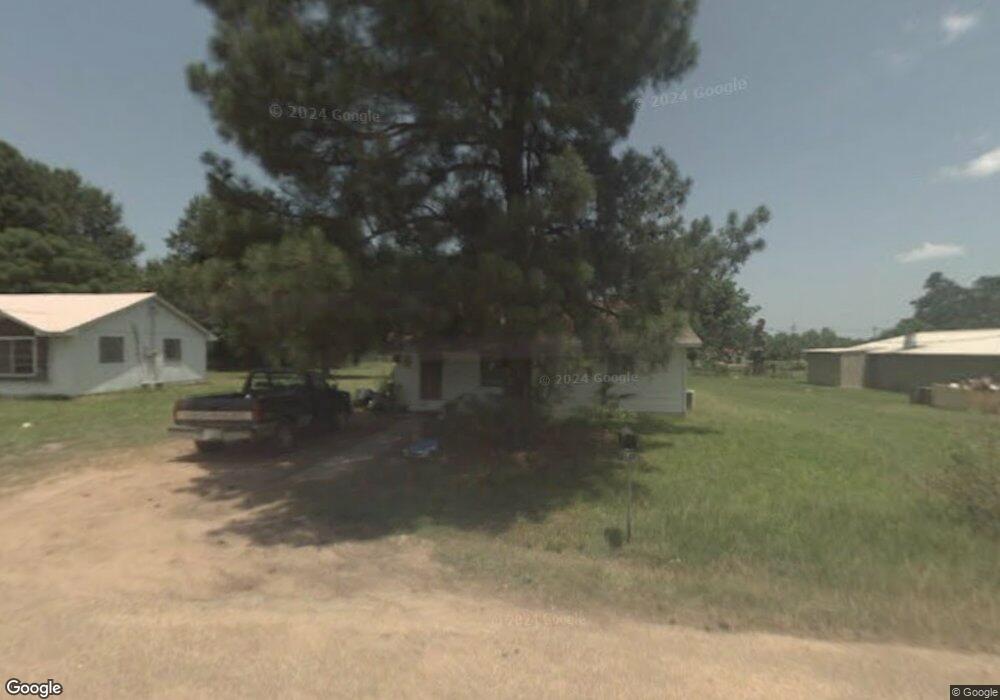
712 Ginn St Foreman, AR 71836
Estimated Value: $49,239 - $136,000
Studio
1
Bath
768
Sq Ft
$107/Sq Ft
Est. Value
About This Home
This home is located at 712 Ginn St, Foreman, AR 71836 and is currently estimated at $82,060, approximately $106 per square foot. 712 Ginn St is a home located in Little River County with nearby schools including Oscar Hamilton Elementary School and Foreman High School.
Ownership History
Date
Name
Owned For
Owner Type
Purchase Details
Closed on
Jan 26, 2018
Bought by
Turk Andrea M
Current Estimated Value
Purchase Details
Closed on
Jun 24, 2015
Bought by
State Of Arkansas 2012 and Gregory Ronnie
Purchase Details
Closed on
Jan 2, 2013
Bought by
State Of Arkansas 2008 and Gregory Ronnie
Purchase Details
Closed on
Jun 16, 2011
Bought by
State Of Arkansas 2008 and Gregory Ronnie
Purchase Details
Closed on
Jul 23, 2009
Bought by
Gregory Ronnie
Purchase Details
Closed on
Jun 5, 2007
Bought by
State Of Arkansas 2004 and Ronnie Gregory
Purchase Details
Closed on
Jun 18, 2002
Bought by
Gregory Ronnie
Purchase Details
Closed on
Nov 9, 2000
Bought by
State Of Arkansas 1997 and Ronnie Gregory
Purchase Details
Closed on
Jul 21, 1998
Bought by
State Of Arkansas 1995 and Ronnie Gregory
Purchase Details
Closed on
Mar 12, 1998
Bought by
State Of Arkansas 1995 and C J
Purchase Details
Closed on
Sep 10, 1997
Bought by
Crawford Crawford C and Crawford Lois
Create a Home Valuation Report for This Property
The Home Valuation Report is an in-depth analysis detailing your home's value as well as a comparison with similar homes in the area
Purchase History
| Date | Buyer | Sale Price | Title Company |
|---|---|---|---|
| Turk Andrea M | $12,000 | -- | |
| State Of Arkansas 2012 | -- | -- | |
| State Of Arkansas 2008 | -- | -- | |
| State Of Arkansas 2008 | -- | -- | |
| Gregory Ronnie | -- | -- | |
| State Of Arkansas 2004 | -- | -- | |
| Gregory Ronnie | -- | -- | |
| State Of Arkansas 1997 | -- | -- | |
| State Of Arkansas 1995 | -- | -- | |
| State Of Arkansas 1995 | -- | -- | |
| Crawford Crawford C | $39,400 | -- |
Source: Public Records
Tax History
| Year | Tax Paid | Tax Assessment Tax Assessment Total Assessment is a certain percentage of the fair market value that is determined by local assessors to be the total taxable value of land and additions on the property. | Land | Improvement |
|---|---|---|---|---|
| 2025 | $230 | $4,330 | $410 | $3,920 |
| 2024 | $230 | $4,330 | $410 | $3,920 |
| 2023 | $230 | $4,330 | $410 | $3,920 |
| 2022 | $230 | $4,330 | $410 | $3,920 |
| 2021 | $213 | $4,000 | $620 | $3,380 |
| 2020 | $213 | $4,000 | $620 | $3,380 |
| 2019 | $213 | $4,000 | $620 | $3,380 |
| 2018 | $179 | $4,000 | $620 | $3,380 |
| 2017 | $163 | $4,000 | $620 | $3,380 |
| 2016 | $148 | $3,430 | $600 | $2,830 |
| 2015 | $148 | $3,430 | $600 | $2,830 |
| 2014 | $143 | $3,430 | $600 | $2,830 |
Source: Public Records
Map
Nearby Homes
- 0 Arkansas 41
- 1311 E 3rd Ave
- 604 N Bell St
- 900 Little River 13
- 1053 Lr 18
- 2539 Highway 32 W
- 120 Lr 180
- 2013 Hwy 32 W
- 1938 Highway 32 W
- 416 Arkinda Ln
- 19 ac New Dora Rd
- 0 New Dora Rd
- 1071 Lr 3
- 512 Pine St
- 808 Broad St
- 0 Butler Rd
- 317 High St
- 0 Fox Pen Rd Unit 26552742
- 4375 Arkansas 234
- 209 Little River 46
Your Personal Tour Guide
Ask me questions while you tour the home.