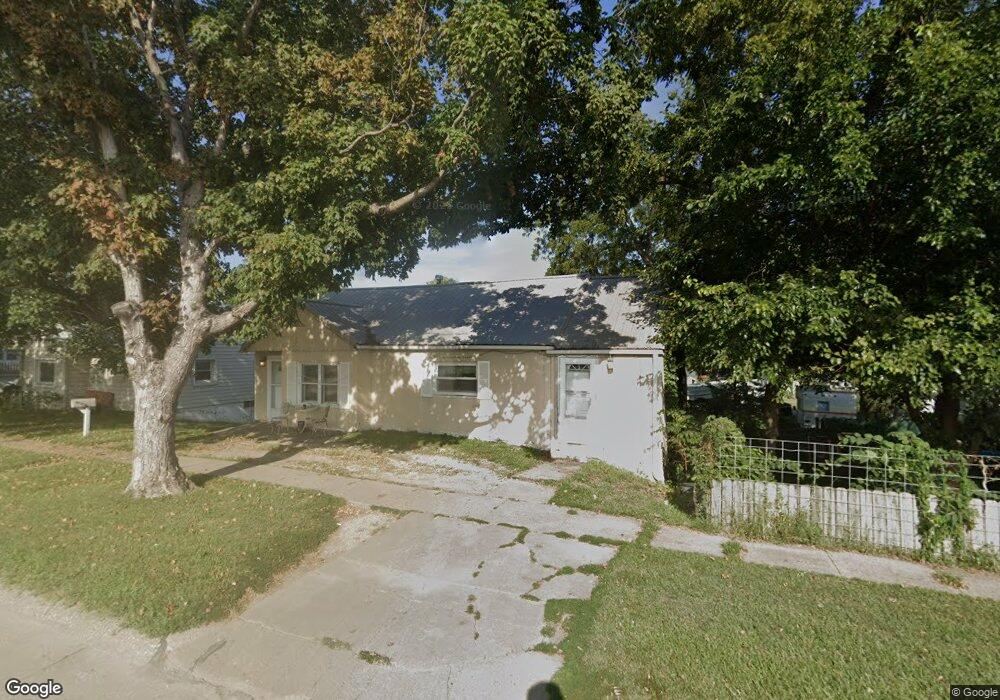
712 Harlan St Falls City, NE 68355
Estimated Value: $53,000 - $72,000
2
Beds
2
Baths
978
Sq Ft
$65/Sq Ft
Est. Value
About This Home
This home is located at 712 Harlan St, Falls City, NE 68355 and is currently estimated at $63,297, approximately $64 per square foot. 712 Harlan St is a home located in Richardson County with nearby schools including Falls City North Elementary School, Falls City South Elementary School, and Falls City Middle School.
Ownership History
Date
Name
Owned For
Owner Type
Purchase Details
Closed on
Apr 11, 2013
Sold by
Kramer David J
Bought by
Unruh Mithcell D and Unruh Patricia S
Current Estimated Value
Home Financials for this Owner
Home Financials are based on the most recent Mortgage that was taken out on this home.
Original Mortgage
$15,000
Interest Rate
3.67%
Mortgage Type
New Conventional
Purchase Details
Closed on
Sep 25, 2012
Sold by
Federal National Mortgage Association
Bought by
Kramer David J
Purchase Details
Closed on
Apr 26, 2004
Sold by
Abbott Elsworth L and Abbott Florence I
Bought by
Diaz Shirley I
Purchase Details
Closed on
Dec 11, 2003
Sold by
Diaz Trust Shirley I
Bought by
Abbott Elsworth and Abbott Florence
Purchase Details
Closed on
Oct 15, 2003
Sold by
Diaz Shirley I
Bought by
Diaz Trust Shirley I
Purchase Details
Closed on
Oct 10, 2003
Sold by
Abbott Elsworth and Abbott Florence
Bought by
Diaz Shirley I
Purchase Details
Closed on
Dec 20, 2002
Sold by
Ramer Jr Eugene D and Ramer Jr Lisa
Bought by
Abbott Elsworth and Abbott Florence
Purchase Details
Closed on
Jun 24, 2002
Sold by
Ramer Elaine Pauline
Bought by
Ramer Jr Eugene D and Ramer Jr Lisa
Create a Home Valuation Report for This Property
The Home Valuation Report is an in-depth analysis detailing your home's value as well as a comparison with similar homes in the area
Home Values in the Area
Average Home Value in this Area
Purchase History
| Date | Buyer | Sale Price | Title Company |
|---|---|---|---|
| Unruh Mithcell D | -- | -- | |
| Kramer David J | -- | -- | |
| Diaz Shirley I | -- | -- | |
| Abbott Elsworth | -- | -- | |
| Diaz Trust Shirley I | -- | -- | |
| Diaz Shirley I | -- | -- | |
| Abbott Elsworth | $22,900 | -- | |
| Ramer Jr Eugene D | -- | -- |
Source: Public Records
Mortgage History
| Date | Status | Borrower | Loan Amount |
|---|---|---|---|
| Closed | Unruh Mithcell D | $15,000 | |
| Closed | Kramer David J | $0 |
Source: Public Records
Tax History Compared to Growth
Tax History
| Year | Tax Paid | Tax Assessment Tax Assessment Total Assessment is a certain percentage of the fair market value that is determined by local assessors to be the total taxable value of land and additions on the property. | Land | Improvement |
|---|---|---|---|---|
| 2025 | $435 | $38,291 | $3,030 | $35,261 |
| 2024 | $435 | $36,295 | $3,030 | $33,265 |
| 2023 | $582 | $35,484 | $3,030 | $32,454 |
| 2022 | $633 | $32,967 | $1,652 | $31,315 |
| 2021 | $544 | $29,033 | $1,652 | $27,381 |
| 2020 | $525 | $27,729 | $1,652 | $26,077 |
| 2019 | $519 | $26,969 | $1,652 | $25,317 |
| 2018 | $510 | $26,232 | $1,652 | $24,580 |
| 2017 | $510 | $26,232 | $1,652 | $24,580 |
| 2016 | $494 | $25,516 | $1,652 | $23,864 |
| 2015 | $496 | $25,516 | $1,652 | $23,864 |
| 2014 | $495 | $25,516 | $1,652 | $23,864 |
Source: Public Records
Map
Nearby Homes