712 Hyak Way Fox Island, WA 98333
Estimated Value: $434,000 - $940,000
2
Beds
2
Baths
1,201
Sq Ft
$493/Sq Ft
Est. Value
About This Home
This home is located at 712 Hyak Way, Fox Island, WA 98333 and is currently estimated at $592,391, approximately $493 per square foot. 712 Hyak Way is a home with nearby schools including Voyager Elementary School, Kopachuck Middle School, and Gig Harbor High School.
Ownership History
Date
Name
Owned For
Owner Type
Purchase Details
Closed on
Dec 12, 2024
Sold by
Fallon-Menke Colleen and Menke Robin J
Bought by
Kevin J Fallon Revocable Living Trust and Colleen Fallon-Menke And Robin Menke Family T
Current Estimated Value
Purchase Details
Closed on
Sep 9, 2024
Sold by
Patrick Roby Llc
Bought by
Fallon William P and Menke Robin J
Purchase Details
Closed on
Oct 23, 2018
Sold by
Fallon William Patrick
Bought by
Patrick Roby Llc
Purchase Details
Closed on
Oct 26, 1994
Sold by
Lopez Larry
Bought by
Menke Robin J and Fallon Menke Colleen
Create a Home Valuation Report for This Property
The Home Valuation Report is an in-depth analysis detailing your home's value as well as a comparison with similar homes in the area
Home Values in the Area
Average Home Value in this Area
Purchase History
| Date | Buyer | Sale Price | Title Company |
|---|---|---|---|
| Kevin J Fallon Revocable Living Trust | $436,000 | None Listed On Document | |
| Fallon William P | -- | None Listed On Document | |
| Patrick Roby Llc | -- | None Available | |
| Menke Robin J | $64,000 | Rainier Title Company |
Source: Public Records
Tax History Compared to Growth
Tax History
| Year | Tax Paid | Tax Assessment Tax Assessment Total Assessment is a certain percentage of the fair market value that is determined by local assessors to be the total taxable value of land and additions on the property. | Land | Improvement |
|---|---|---|---|---|
| 2025 | $5,202 | $620,800 | $344,000 | $276,800 |
| 2024 | $5,202 | $587,200 | $325,900 | $261,300 |
| 2023 | $5,202 | $541,000 | $289,700 | $251,300 |
| 2022 | $4,446 | $548,100 | $289,700 | $258,400 |
| 2021 | $3,170 | $281,200 | $185,600 | $95,600 |
| 2019 | $1,377 | $139,500 | $139,500 | $0 |
| 2018 | $1,369 | $127,900 | $127,900 | $0 |
| 2017 | $1,091 | $116,200 | $116,200 | $0 |
| 2016 | $919 | $79,800 | $79,800 | $0 |
| 2014 | $625 | $75,200 | $75,200 | $0 |
| 2013 | $625 | $75,300 | $75,300 | $0 |
Source: Public Records
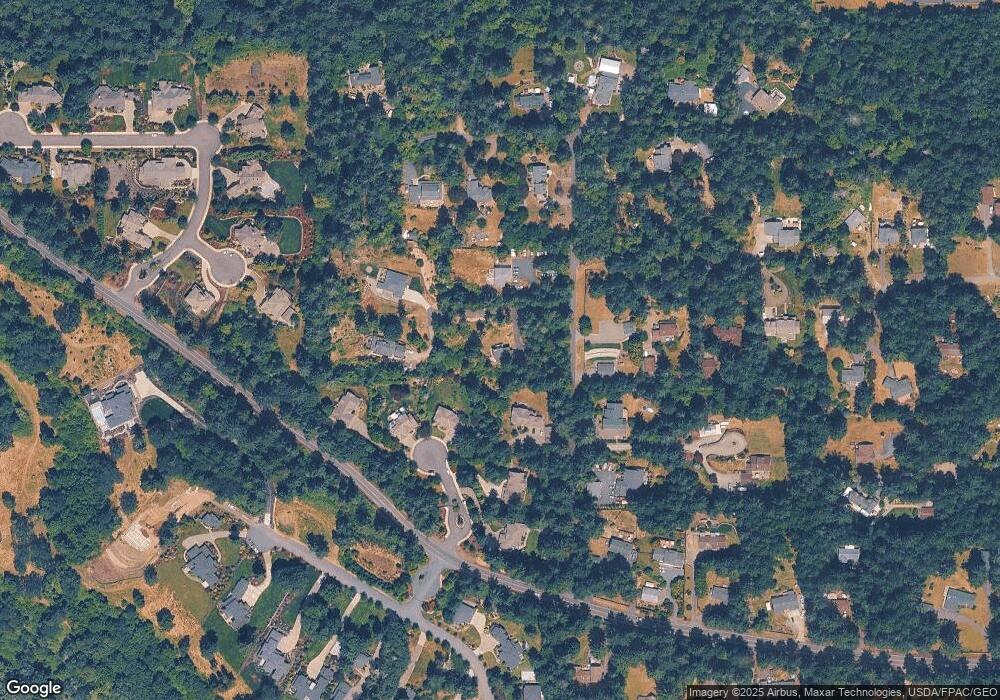
Map
Nearby Homes