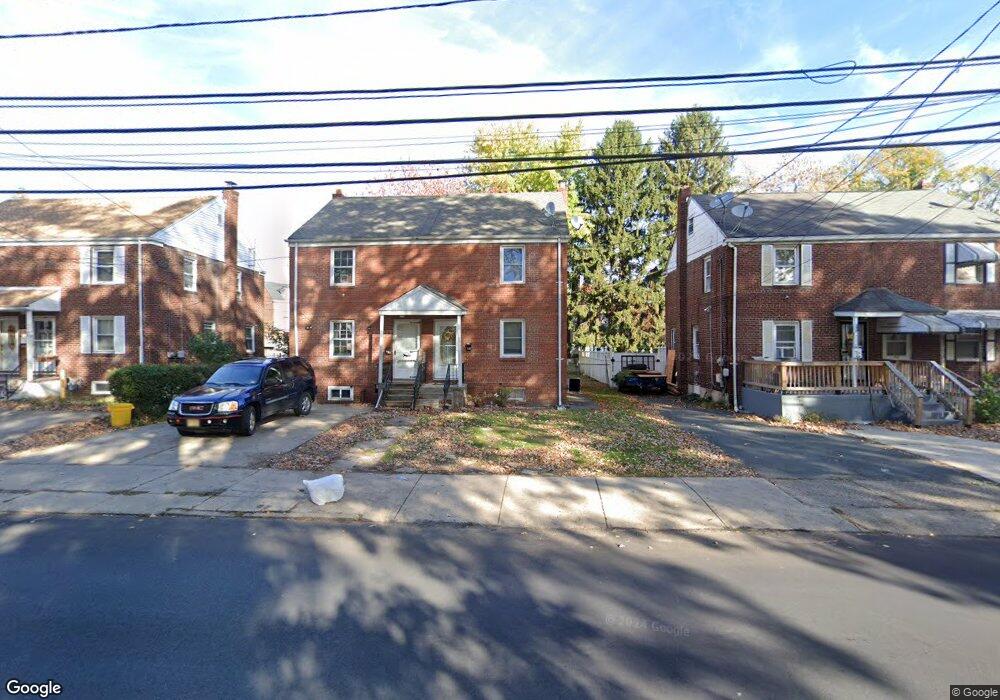
712 Lalor St Trenton, NJ 08610
Franklin Park NeighborhoodEstimated Value: $128,000 - $193,000
2
Beds
1
Bath
832
Sq Ft
$191/Sq Ft
Est. Value
About This Home
This home is located at 712 Lalor St, Trenton, NJ 08610 and is currently estimated at $158,640, approximately $190 per square foot. 712 Lalor St is a home located in Mercer County with nearby schools including Franklin Elementary School, Dr. Crosby Copeland Elementary School, and Grace A Dunn Middle School.
Ownership History
Date
Name
Owned For
Owner Type
Purchase Details
Closed on
Sep 17, 2008
Sold by
Hud
Bought by
Giliberti Marcel and Lovelcho Luis A
Current Estimated Value
Purchase Details
Closed on
Jun 12, 2008
Sold by
Countrywide Home Loans Inc
Bought by
Hud
Purchase Details
Closed on
May 23, 2008
Sold by
Sheriff Of Mercer
Bought by
Countrywide Home Loans Inc
Purchase Details
Closed on
Dec 14, 2005
Sold by
Feng Sheng Ping
Bought by
Zacharias Eliseo and Faria Michelle
Home Financials for this Owner
Home Financials are based on the most recent Mortgage that was taken out on this home.
Original Mortgage
$101,408
Interest Rate
6.33%
Mortgage Type
FHA
Create a Home Valuation Report for This Property
The Home Valuation Report is an in-depth analysis detailing your home's value as well as a comparison with similar homes in the area
Home Values in the Area
Average Home Value in this Area
Purchase History
| Date | Buyer | Sale Price | Title Company |
|---|---|---|---|
| Giliberti Marcel | $61,000 | -- | |
| Hud | -- | -- | |
| Countrywide Home Loans Inc | -- | -- | |
| Zacharias Eliseo | $103,000 | -- |
Source: Public Records
Mortgage History
| Date | Status | Borrower | Loan Amount |
|---|---|---|---|
| Previous Owner | Zacharias Eliseo | $101,408 |
Source: Public Records
Tax History Compared to Growth
Tax History
| Year | Tax Paid | Tax Assessment Tax Assessment Total Assessment is a certain percentage of the fair market value that is determined by local assessors to be the total taxable value of land and additions on the property. | Land | Improvement |
|---|---|---|---|---|
| 2025 | $2,257 | $38,900 | $7,600 | $31,300 |
| 2024 | $2,166 | $38,900 | $7,600 | $31,300 |
| 2023 | $2,166 | $38,900 | $7,600 | $31,300 |
| 2022 | $2,123 | $38,900 | $7,600 | $31,300 |
| 2021 | $2,160 | $38,900 | $7,600 | $31,300 |
| 2020 | $2,153 | $38,900 | $7,600 | $31,300 |
| 2019 | $2,118 | $38,900 | $7,600 | $31,300 |
| 2018 | $2,028 | $38,900 | $7,600 | $31,300 |
| 2017 | $1,928 | $38,900 | $7,600 | $31,300 |
| 2016 | $3,515 | $61,100 | $16,000 | $45,100 |
| 2015 | $3,503 | $61,100 | $16,000 | $45,100 |
| 2014 | $3,486 | $61,100 | $16,000 | $45,100 |
Source: Public Records
Map
Nearby Homes