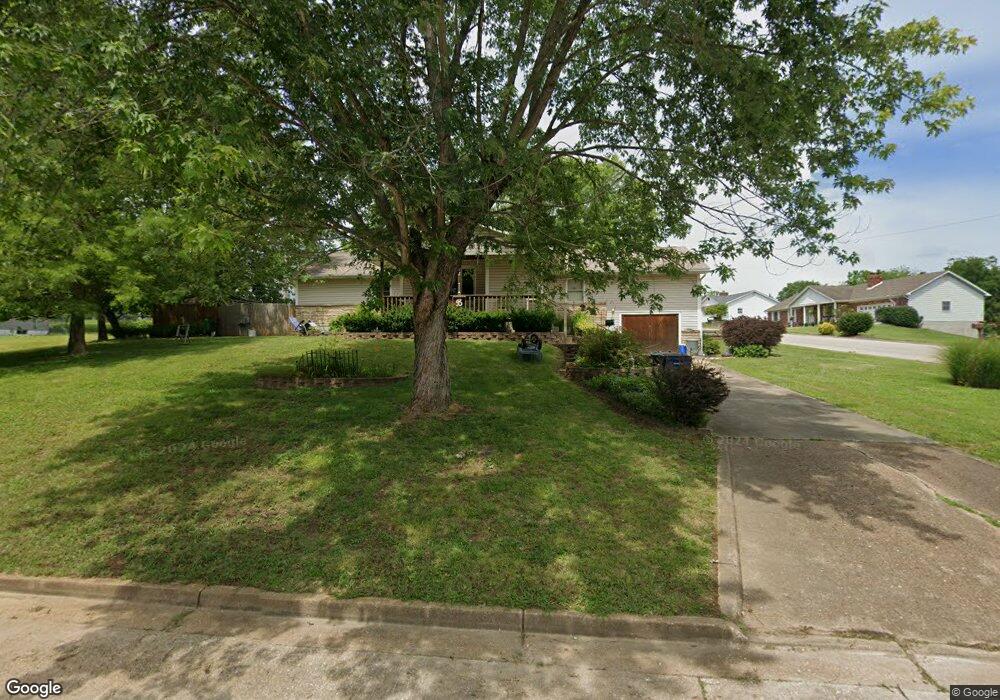
712 N 9th St de Soto, MO 63020
Estimated Value: $200,000 - $252,000
4
Beds
2
Baths
1,522
Sq Ft
$154/Sq Ft
Est. Value
About This Home
This home is located at 712 N 9th St, de Soto, MO 63020 and is currently estimated at $233,890, approximately $153 per square foot. 712 N 9th St is a home located in Jefferson County with nearby schools including De Soto Senior High School and St Rose Of Lima School.
Ownership History
Date
Name
Owned For
Owner Type
Purchase Details
Closed on
Nov 16, 2015
Sold by
Butler Edward P and Butler Phyllis
Bought by
Butler Edward P and Butler Phyllis
Current Estimated Value
Purchase Details
Closed on
Jul 23, 2010
Sold by
Secretary Of Housing & Urban Development
Bought by
Butler Edward
Purchase Details
Closed on
Apr 12, 2010
Sold by
Bac Home Loans Servicing L P
Bought by
Secretary Of Housing & Urban Development
Purchase Details
Closed on
Jul 6, 2005
Sold by
Westhoff Kenneth M and Westhoff Dawn
Bought by
Dollar Ricky P and Dollar Deborah L
Home Financials for this Owner
Home Financials are based on the most recent Mortgage that was taken out on this home.
Original Mortgage
$126,000
Interest Rate
7.7%
Mortgage Type
Fannie Mae Freddie Mac
Create a Home Valuation Report for This Property
The Home Valuation Report is an in-depth analysis detailing your home's value as well as a comparison with similar homes in the area
Home Values in the Area
Average Home Value in this Area
Purchase History
| Date | Buyer | Sale Price | Title Company |
|---|---|---|---|
| Butler Edward P | -- | None Available | |
| Butler Edward | -- | Northwest Title Agency Inc | |
| Secretary Of Housing & Urban Development | -- | None Available | |
| Dollar Ricky P | -- | Freedom Title |
Source: Public Records
Mortgage History
| Date | Status | Borrower | Loan Amount |
|---|---|---|---|
| Previous Owner | Dollar Ricky P | $126,000 |
Source: Public Records
Tax History Compared to Growth
Tax History
| Year | Tax Paid | Tax Assessment Tax Assessment Total Assessment is a certain percentage of the fair market value that is determined by local assessors to be the total taxable value of land and additions on the property. | Land | Improvement |
|---|---|---|---|---|
| 2025 | $1,321 | $22,500 | $1,800 | $20,700 |
| 2024 | $1,321 | $20,600 | $1,800 | $18,800 |
| 2023 | $1,321 | $20,600 | $1,800 | $18,800 |
| 2022 | $1,312 | $20,500 | $1,800 | $18,700 |
| 2021 | $1,310 | $20,500 | $1,800 | $18,700 |
| 2020 | $1,193 | $18,300 | $1,400 | $16,900 |
| 2019 | $1,191 | $18,300 | $1,400 | $16,900 |
| 2018 | $1,161 | $18,300 | $1,400 | $16,900 |
| 2017 | $1,157 | $18,300 | $1,400 | $16,900 |
| 2016 | $1,075 | $16,700 | $1,600 | $15,100 |
| 2015 | $1,069 | $16,700 | $1,600 | $15,100 |
| 2013 | -- | $15,900 | $1,600 | $14,300 |
Source: Public Records
Map
Nearby Homes
- 517 N 11th St
- 407 N 11th St
- 1504 Essex Heights Dr
- 300 Valley Place
- 821 N 3rd St
- 358 N Thomas St
- 3 Easton St
- 350 N Thomas St
- 1533 Hickory Landing
- 1535 Hickory Landing
- 600 Allen Place
- 422 N 2nd St
- 306 N Thomas St
- 1551 Hickory Landing
- 115 N 5th St
- 1553 Hickory Landing
- 1618 N 6th St
- 1561 Hickory Landing
- 4 Easton St
- 513 W Mineral St