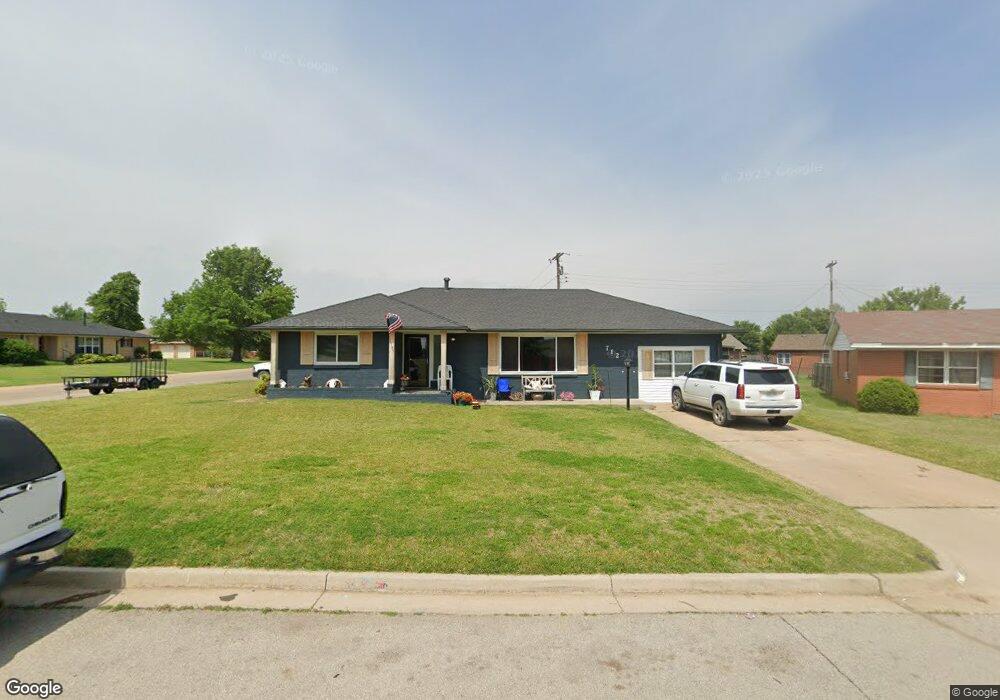
712 Neal Cir El Reno, OK 73036
Estimated Value: $165,000 - $176,706
2
Beds
1
Bath
1,690
Sq Ft
$101/Sq Ft
Est. Value
About This Home
This home is located at 712 Neal Cir, El Reno, OK 73036 and is currently estimated at $171,427, approximately $101 per square foot. 712 Neal Cir is a home located in Canadian County with nearby schools including Hillcrest Elementary School, Lincoln Learning Center, and Rose Witcher Elementary School.
Ownership History
Date
Name
Owned For
Owner Type
Purchase Details
Closed on
Jan 22, 2016
Sold by
Schneider Alicia L and Schneider John
Bought by
Surovik Carrie Lynn and Blanc Linda Sue
Current Estimated Value
Home Financials for this Owner
Home Financials are based on the most recent Mortgage that was taken out on this home.
Original Mortgage
$76,312
Outstanding Balance
$60,513
Interest Rate
3.87%
Mortgage Type
FHA
Estimated Equity
$110,914
Purchase Details
Closed on
Nov 9, 2007
Sold by
Boutwell Florence
Bought by
Becker Alicia L
Home Financials for this Owner
Home Financials are based on the most recent Mortgage that was taken out on this home.
Original Mortgage
$69,000
Interest Rate
6.42%
Mortgage Type
New Conventional
Purchase Details
Closed on
Aug 12, 2003
Sold by
Schroeder Walter F
Purchase Details
Closed on
Aug 6, 2003
Sold by
Boutwell Florence
Purchase Details
Closed on
Feb 1, 1999
Sold by
Schroeder Walter
Create a Home Valuation Report for This Property
The Home Valuation Report is an in-depth analysis detailing your home's value as well as a comparison with similar homes in the area
Home Values in the Area
Average Home Value in this Area
Purchase History
| Date | Buyer | Sale Price | Title Company |
|---|---|---|---|
| Surovik Carrie Lynn | $98,000 | Old Republic Title | |
| Becker Alicia L | $65,250 | None Available | |
| -- | -- | -- | |
| -- | -- | -- | |
| -- | -- | -- |
Source: Public Records
Mortgage History
| Date | Status | Borrower | Loan Amount |
|---|---|---|---|
| Open | Surovik Carrie Lynn | $76,312 | |
| Previous Owner | Becker Alicia L | $69,000 |
Source: Public Records
Tax History Compared to Growth
Tax History
| Year | Tax Paid | Tax Assessment Tax Assessment Total Assessment is a certain percentage of the fair market value that is determined by local assessors to be the total taxable value of land and additions on the property. | Land | Improvement |
|---|---|---|---|---|
| 2024 | $1,554 | $15,230 | $1,546 | $13,684 |
| 2023 | $1,554 | $14,504 | $1,440 | $13,064 |
| 2022 | $1,486 | $13,814 | $1,440 | $12,374 |
| 2021 | $1,449 | $13,156 | $1,440 | $11,716 |
| 2020 | $1,364 | $12,530 | $1,440 | $11,090 |
| 2019 | $1,356 | $11,933 | $1,440 | $10,493 |
| 2018 | $1,279 | $11,365 | $1,440 | $9,925 |
| 2017 | $1,304 | $11,365 | $1,440 | $9,925 |
| 2016 | $1,180 | $11,666 | $1,440 | $10,226 |
| 2015 | $1,088 | $10,883 | $1,440 | $9,443 |
| 2014 | $1,088 | $10,566 | $1,440 | $9,126 |
Source: Public Records
Map
Nearby Homes
- 1502 S Reno Ave
- 800 Fairfax Ln
- 1309 Fairfax Ln
- 605 Thompson Dr
- 601 Thompson Dr
- 508 SW 24th St
- 1127 S Reno Ave
- 420 SW 24th St
- 1705 S Dille Ave
- 300 Cherokee Ln
- 1515 Strawberry Fields
- 1517 Strawberry
- 2502 Ridgecrest Dr
- 1519 Strawberry Fields
- 1523 Strawberry Fields
- 1220 Strawberry Fields
- 818 SW 26th Place
- 1012 S Ellison Ave
- 2606 Ridgecrest Dr
- 1260 Penny Ln
- 710 Neal Cir
- 1417 S Reno Ave
- 1415 S Reno Ave
- 614 W Matthews St
- 621 W Matthews St
- 708 Neal Cir
- 1411 S Reno Ave
- 623 W Matthews St
- 617 W Matthews St
- 1409 S Reno Ave
- 707 Neal Cir
- 612 W Matthews St
- 706 Neal Cir
- 1407 S Reno Ave
- 1505 S Reno Ave
- 615 W Matthews St
- 1412 S Reno Ave
- 1500 S Reno Ave
- 1408 S Reno Ave
- 1414 S Reno Ave