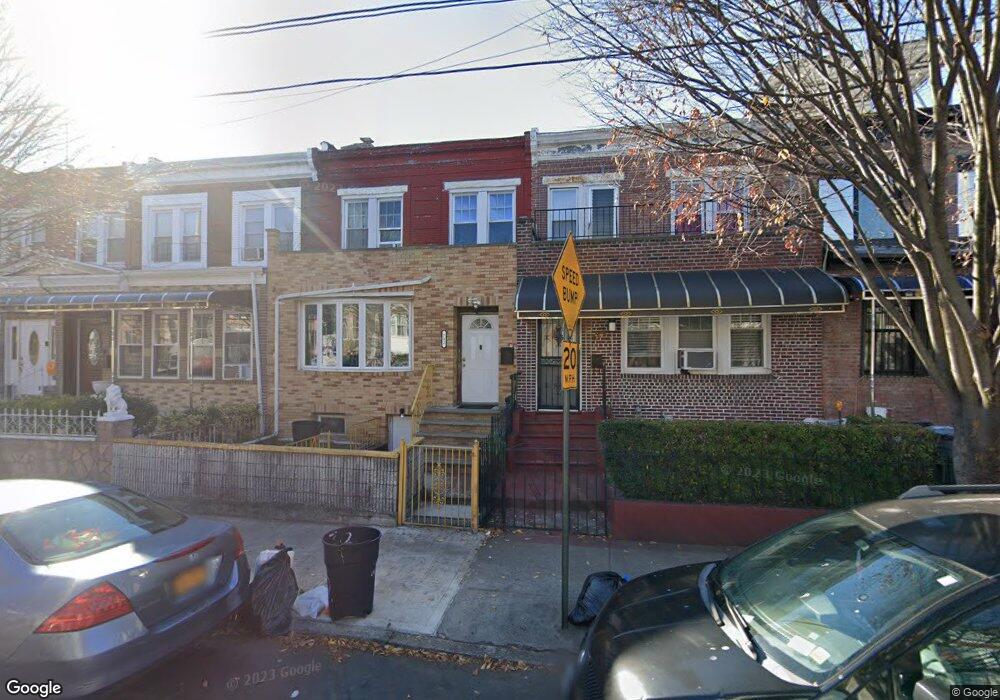
712 New Jersey Ave Brooklyn, NY 11207
East New York NeighborhoodEstimated Value: $643,000 - $684,000
--
Bed
--
Bath
1,620
Sq Ft
$411/Sq Ft
Est. Value
About This Home
This home is located at 712 New Jersey Ave, Brooklyn, NY 11207 and is currently estimated at $666,151, approximately $411 per square foot. 712 New Jersey Ave is a home located in Kings County with nearby schools including P.S. 213 New Lots, Van Siclen Community Middle School, and Achievement First - East New York School.
Ownership History
Date
Name
Owned For
Owner Type
Purchase Details
Closed on
Jun 9, 2006
Sold by
Duncan Lunior
Bought by
Bernard Lunior and Johnson Cary
Current Estimated Value
Purchase Details
Closed on
Nov 26, 2001
Sold by
Duncan Lunior
Bought by
Duncan Lunior
Home Financials for this Owner
Home Financials are based on the most recent Mortgage that was taken out on this home.
Original Mortgage
$164,000
Interest Rate
7.08%
Purchase Details
Closed on
Jun 23, 1999
Sold by
Duncan Lunior
Bought by
Duncan Lunior and Duncan Steve
Purchase Details
Closed on
Dec 22, 1998
Sold by
First Home Properties Corp
Bought by
Duncan Lunior
Home Financials for this Owner
Home Financials are based on the most recent Mortgage that was taken out on this home.
Original Mortgage
$156,442
Interest Rate
6.78%
Mortgage Type
FHA
Purchase Details
Closed on
Oct 9, 1998
Sold by
Brown Foser
Bought by
First Home Properties Corp
Create a Home Valuation Report for This Property
The Home Valuation Report is an in-depth analysis detailing your home's value as well as a comparison with similar homes in the area
Home Values in the Area
Average Home Value in this Area
Purchase History
| Date | Buyer | Sale Price | Title Company |
|---|---|---|---|
| Bernard Lunior | -- | -- | |
| Bernard Lunior | -- | -- | |
| Duncan Lunior | -- | -- | |
| Duncan Lunior | -- | -- | |
| Duncan Lunior | -- | -- | |
| Duncan Lunior | -- | -- | |
| Duncan Lunior | $161,000 | Fidelity National Title Ins | |
| Duncan Lunior | $161,000 | Fidelity National Title Ins | |
| First Home Properties Corp | $95,000 | Fidelity National Title Ins | |
| First Home Properties Corp | $95,000 | Fidelity National Title Ins |
Source: Public Records
Mortgage History
| Date | Status | Borrower | Loan Amount |
|---|---|---|---|
| Previous Owner | Duncan Lunior | $164,000 | |
| Previous Owner | Duncan Lunior | $156,442 | |
| Closed | Bernard Lunior | $0 |
Source: Public Records
Tax History Compared to Growth
Tax History
| Year | Tax Paid | Tax Assessment Tax Assessment Total Assessment is a certain percentage of the fair market value that is determined by local assessors to be the total taxable value of land and additions on the property. | Land | Improvement |
|---|---|---|---|---|
| 2025 | $2,827 | $43,860 | $17,340 | $26,520 |
| 2024 | $2,827 | $41,940 | $17,340 | $24,600 |
| 2023 | $2,684 | $37,080 | $17,340 | $19,740 |
| 2022 | $2,466 | $38,460 | $17,340 | $21,120 |
| 2021 | $2,448 | $34,980 | $17,340 | $17,640 |
| 2020 | $1,214 | $29,220 | $17,340 | $11,880 |
| 2019 | $2,405 | $26,460 | $17,340 | $9,120 |
| 2018 | $2,186 | $12,182 | $7,334 | $4,848 |
| 2017 | $2,043 | $11,493 | $7,097 | $4,396 |
| 2016 | $1,862 | $10,866 | $7,459 | $3,407 |
| 2015 | $1,088 | $10,846 | $6,825 | $4,021 |
| 2014 | $1,088 | $10,747 | $6,226 | $4,521 |
Source: Public Records
Map
Nearby Homes
- 421 New Lots Ave
- 661 Sheffield Ave
- 667 Sheffield Ave
- 762 New Jersey Ave
- 694 Pennsylvania Ave
- 725 Vermont St
- 750 Vermont St
- 521 Hegeman Ave
- 679 Georgia Ave
- 607 Hegeman Ave
- 806 New Jersey Ave
- 700 Bradford St
- 749 Pennsylvania Ave
- 627 Hegeman Ave
- 753 Pennsylvania Ave
- 612 Hegeman Ave
- 494 Hegeman Ave
- 797 Vermont St
- 606 Alabama Ave
- 610 Alabama Ave
- 714 New Jersey Ave
- 714 New Jersey Ave Unit 2
- 708 New Jersey Ave
- 716 New Jersey Ave
- 706 New Jersey Ave
- 718 New Jersey Ave
- 704 New Jersey Ave
- 720 New Jersey Ave
- 647 Pennsylvania Ave
- 649 Pennsylvania Ave Unit 2-F
- 649 Pennsylvania Ave Unit 1-F
- 649 Pennsylvania Ave
- 649 Pennsylvania Ave Unit 2-F
- 722 New Jersey Ave
- 643 Pennsylvania Ave
- 653 Pennsylvania Ave
- 653 Pennsylvania Ave Unit 1A
- 653 Pennsylvania Ave Unit 1B
- 653 Pennsylvania Ave Unit 2B
- 653 Pennsylvania Ave Unit 2A