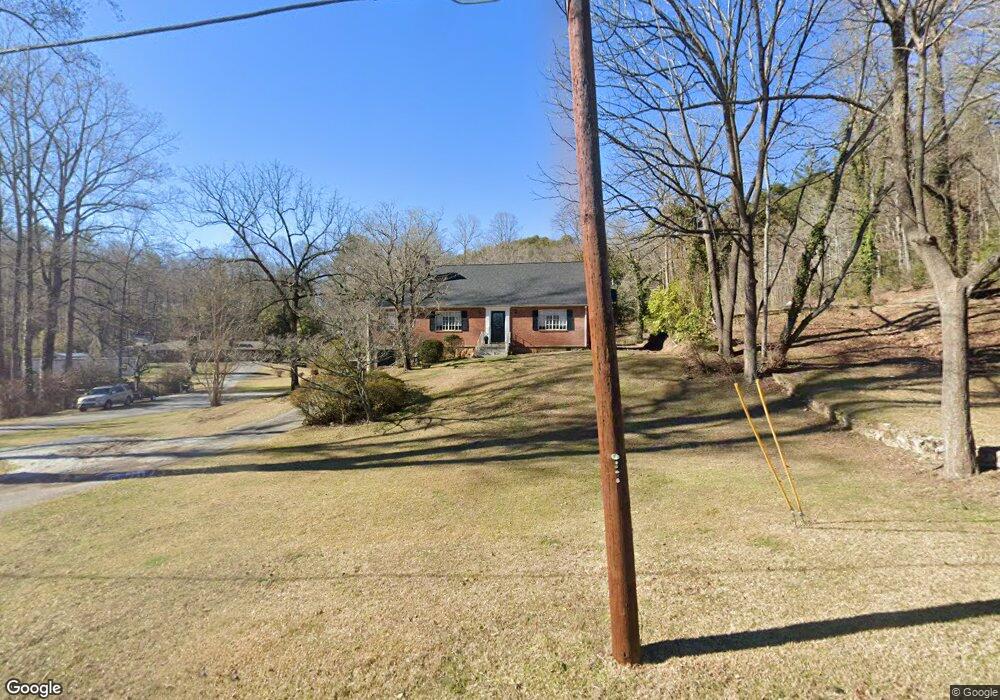
712 Old 441 S Clayton, GA 30525
Estimated Value: $297,000 - $431,000
4
Beds
2
Baths
2,968
Sq Ft
$120/Sq Ft
Est. Value
About This Home
This home is located at 712 Old 441 S, Clayton, GA 30525 and is currently estimated at $356,327, approximately $120 per square foot. 712 Old 441 S is a home located in Rabun County with nearby schools including Rabun County Primary School, Rabun County High School, and Great Oaks Montessori .
Ownership History
Date
Name
Owned For
Owner Type
Purchase Details
Closed on
Dec 30, 2019
Sold by
Floyd Robert H Estate
Bought by
Crane John T and Crane Amanda L
Current Estimated Value
Home Financials for this Owner
Home Financials are based on the most recent Mortgage that was taken out on this home.
Original Mortgage
$154,646
Outstanding Balance
$135,754
Interest Rate
3.6%
Mortgage Type
FHA
Estimated Equity
$220,573
Purchase Details
Closed on
Mar 2, 2018
Sold by
Free Eleanor F
Bought by
Floyd Robert H
Purchase Details
Closed on
Dec 27, 2013
Sold by
Free Eleanor F
Bought by
Wright Carvin Bruce and Wright Kathy G
Purchase Details
Closed on
Feb 1, 2006
Sold by
Not Provided
Bought by
Floyd Robert H and Free Eleanor
Purchase Details
Closed on
Oct 1, 1945
Create a Home Valuation Report for This Property
The Home Valuation Report is an in-depth analysis detailing your home's value as well as a comparison with similar homes in the area
Home Values in the Area
Average Home Value in this Area
Purchase History
| Date | Buyer | Sale Price | Title Company |
|---|---|---|---|
| Crane John T | $157,500 | -- | |
| Crane John T | $157,500 | -- | |
| Floyd Robert H | $60,000 | -- | |
| Wright Carvin Bruce | -- | -- | |
| Wright Carvin Bruce | -- | -- | |
| Wright Carvin Bruce | -- | -- | |
| Wright Carvin Bruce | -- | -- | |
| Floyd Robert H | -- | -- | |
| Floyd Robert H | -- | -- | |
| Floyd Robert H | -- | -- | |
| Floyd Robert H | -- | -- | |
| Floyd Robert H | -- | -- | |
| -- | $6,600 | -- | |
| -- | $6,600 | -- |
Source: Public Records
Mortgage History
| Date | Status | Borrower | Loan Amount |
|---|---|---|---|
| Open | Crane John T | $154,646 | |
| Closed | Crane John T | $154,646 |
Source: Public Records
Tax History Compared to Growth
Tax History
| Year | Tax Paid | Tax Assessment Tax Assessment Total Assessment is a certain percentage of the fair market value that is determined by local assessors to be the total taxable value of land and additions on the property. | Land | Improvement |
|---|---|---|---|---|
| 2025 | $2,044 | $92,487 | $9,600 | $82,887 |
| 2024 | $2,005 | $87,229 | $9,600 | $77,629 |
| 2023 | $2,001 | $76,717 | $6,720 | $69,997 |
| 2022 | $1,358 | $74,174 | $6,720 | $67,454 |
| 2021 | $1,803 | $66,008 | $6,720 | $59,288 |
| 2020 | $1,663 | $59,032 | $6,720 | $52,312 |
| 2019 | $845 | $43,284 | $6,160 | $37,124 |
| 2018 | $1,201 | $43,284 | $6,160 | $37,124 |
| 2017 | $814 | $43,284 | $6,160 | $37,124 |
| 2016 | $816 | $43,284 | $6,160 | $37,124 |
| 2015 | $734 | $38,120 | $6,160 | $31,960 |
| 2014 | $738 | $38,120 | $6,160 | $31,960 |
Source: Public Records
Map
Nearby Homes
- 335 S Main St
- 60 Mitchell St
- 0 Toole St Unit 10538991
- 7 Dry Pond Dr
- 893 Old 441 S
- 276 Dunlap St
- 167 Travelers Ln
- 112 Clayton Dr
- 407 Hillside Dr
- 0 Travelers Ln Unit 10608680
- 0 Travelers Ln Unit 10590360
- 5 W Pinecrest Dr
- 0 Jericho Ln Unit 10624133
- 9 Golf Dr
- 41 Mike Foster Ln
- LOTS 92 & 93 Chechero Heights St
- 331 Duggan Hill Dr
- 0 Post Oak St Unit LOT 15
- 127 Hamby St
- 66 Post Oak St
- 692 Old 441 S
- 20 Saber Ln
- 681 Old 441 S
- 54 Dunlap St
- 677 Old 441 S
- 68 Saber Ln
- 657 Old 441 S
- 649 Old 441 S
- 649 Old 441 S
- 649 Old 441 S
- 6 Dunlap St
- 106 Dunlap St Unit 8
- 106 Dunlap St Unit 29 & 30 108
- 106 Dunlap St Unit 29
- 788 Old 441 S
- 108 Dunlap St
- 616 Old 441 S
- 24 Panther Trail
- 725 Old 441 S
- 719 Old 441 S