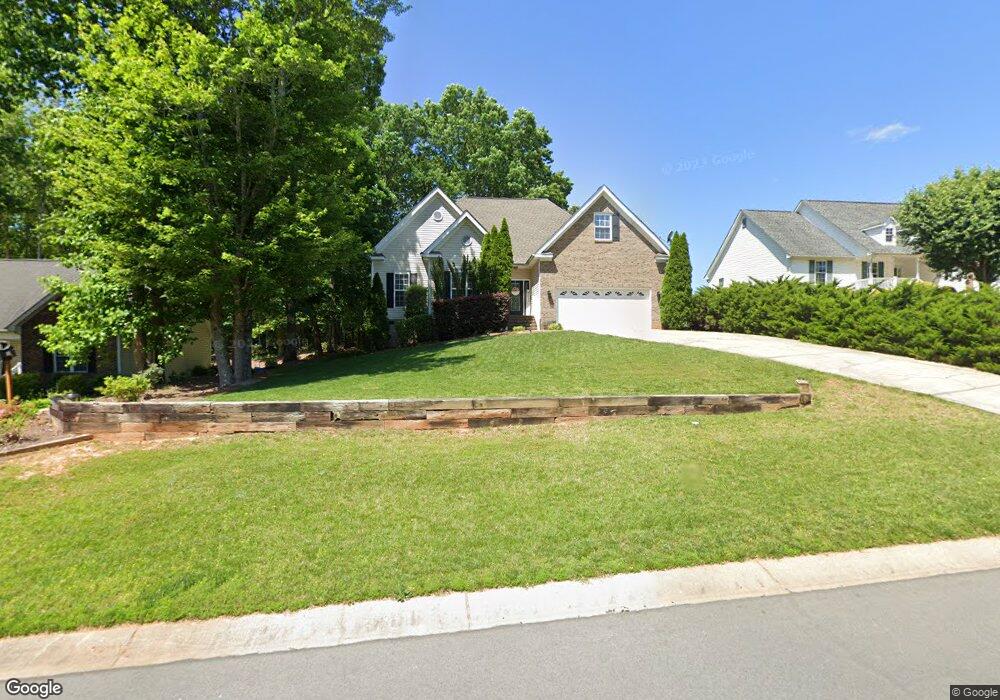
712 Redah Ave Locust, NC 28097
Estimated Value: $456,661 - $554,000
5
Beds
3
Baths
2,445
Sq Ft
$205/Sq Ft
Est. Value
About This Home
This home is located at 712 Redah Ave, Locust, NC 28097 and is currently estimated at $501,165, approximately $204 per square foot. 712 Redah Ave is a home located in Stanly County with nearby schools including Locust Elementary School, West Stanly Middle School, and West Stanly High School.
Ownership History
Date
Name
Owned For
Owner Type
Purchase Details
Closed on
Apr 24, 2015
Sold by
Huneycutt Brent A and Huneycutt Brandy
Bought by
Speights Ronald Chase and Speights Jennifer S
Current Estimated Value
Home Financials for this Owner
Home Financials are based on the most recent Mortgage that was taken out on this home.
Original Mortgage
$216,997
Outstanding Balance
$167,834
Interest Rate
3.87%
Mortgage Type
FHA
Estimated Equity
$333,331
Purchase Details
Closed on
Nov 16, 2007
Sold by
Jh Builders Inc
Bought by
Huneycutt Brent A and Huneycutt Brandy
Home Financials for this Owner
Home Financials are based on the most recent Mortgage that was taken out on this home.
Original Mortgage
$188,000
Interest Rate
6.26%
Mortgage Type
New Conventional
Purchase Details
Closed on
May 2, 2006
Sold by
Bbs Builders Inc
Bought by
Jqh Builders Inc
Create a Home Valuation Report for This Property
The Home Valuation Report is an in-depth analysis detailing your home's value as well as a comparison with similar homes in the area
Home Values in the Area
Average Home Value in this Area
Purchase History
| Date | Buyer | Sale Price | Title Company |
|---|---|---|---|
| Speights Ronald Chase | $221,000 | None Available | |
| Huneycutt Brent A | $215,000 | None Available | |
| Jqh Builders Inc | $35,500 | None Available |
Source: Public Records
Mortgage History
| Date | Status | Borrower | Loan Amount |
|---|---|---|---|
| Open | Speights Ronald Chase | $216,997 | |
| Previous Owner | Huneycutt Brent A | $188,000 |
Source: Public Records
Tax History Compared to Growth
Tax History
| Year | Tax Paid | Tax Assessment Tax Assessment Total Assessment is a certain percentage of the fair market value that is determined by local assessors to be the total taxable value of land and additions on the property. | Land | Improvement |
|---|---|---|---|---|
| 2025 | $3,395 | $368,982 | $65,000 | $303,982 |
| 2024 | $2,851 | $261,578 | $44,000 | $217,578 |
| 2023 | $2,971 | $261,578 | $44,000 | $217,578 |
| 2022 | $2,945 | $261,578 | $44,000 | $217,578 |
| 2021 | $2,919 | $261,578 | $44,000 | $217,578 |
| 2020 | $2,571 | $219,238 | $25,000 | $194,238 |
| 2019 | $2,597 | $219,238 | $25,000 | $194,238 |
| 2018 | $2,477 | $219,238 | $25,000 | $194,238 |
| 2017 | $2,477 | $219,238 | $25,000 | $194,238 |
| 2016 | $2,481 | $219,555 | $30,000 | $189,555 |
| 2015 | $2,592 | $219,555 | $30,000 | $189,555 |
| 2014 | $2,659 | $219,555 | $30,000 | $189,555 |
Source: Public Records
Map
Nearby Homes
- 708 Redah Ave
- 540 Church St
- 402 Church St
- 27 Berea Baptist Church Rd
- 174 Willow Creek Dr
- 103 Berea Baptist Church Rd
- 105 Berea Baptist Church Rd
- 211 Drive Inn Rd
- 606 Elm St
- 201 Oak St
- 417 Kiser Ln
- 124 Hickory Ridge Dr
- 128 Hickory Ridge Dr
- 0 N Carolina 200
- 4034 N Carolina 200
- 4036 N Carolina 200
- 146 Kerri Dawn Ln
- 110 Forest Dr
- 00 W Stanly St
- 000 N Renee Ford Rd
- 712 Redah Ave Unit 35
- 710 Redah Ave
- 714 Redah Ave
- 716 Redah Ave Unit 33
- 716 Redah Ave
- 711 Redah Ave
- 711 Redah Ave Unit 6
- 713 Redah Ave
- 709 Redah Ave
- 718 Redah Ave
- 706 Redah Ave
- 273 Ella Dr Unit 46
- 715 Redah Ave
- 707 Redah Ave
- 720 Redah Ave
- 704 Redah Ave
- 705 Redah Ave
- 280 Ella Dr
- 274 Ella Dr
- 253 Ella Dr