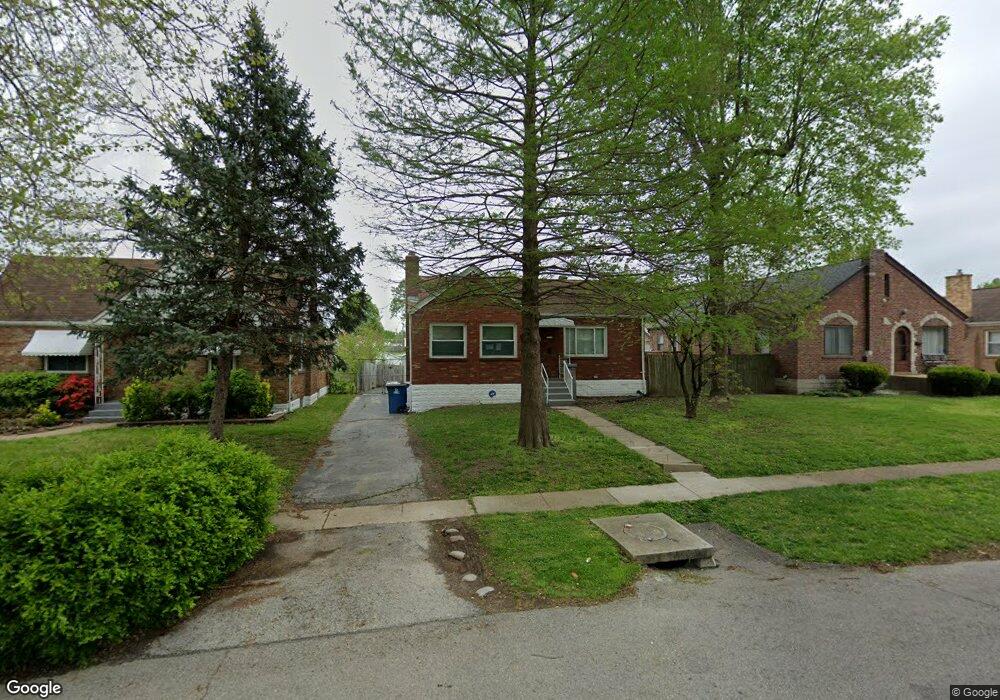
712 Reed Ave Saint Louis, MO 63125
Lemay NeighborhoodEstimated Value: $155,000 - $207,000
2
Beds
1
Bath
881
Sq Ft
$194/Sq Ft
Est. Value
About This Home
This home is located at 712 Reed Ave, Saint Louis, MO 63125 and is currently estimated at $170,680, approximately $193 per square foot. 712 Reed Ave is a home located in St. Louis County with nearby schools including Hancock Place Elementary School, Hancock Place Middle School, and Hancock Place High School.
Ownership History
Date
Name
Owned For
Owner Type
Purchase Details
Closed on
Dec 9, 2022
Sold by
Sfr3-000 Llc
Bought by
Sfr3-080 Llc
Current Estimated Value
Purchase Details
Closed on
Mar 31, 2021
Sold by
Growth Developments Llc
Bought by
Sfr3 020 Llc
Purchase Details
Closed on
Nov 22, 2006
Sold by
Worsham Michael C and Worsham Nora
Bought by
Worsham Michael C and Worsham Nora
Home Financials for this Owner
Home Financials are based on the most recent Mortgage that was taken out on this home.
Original Mortgage
$97,000
Interest Rate
6.37%
Mortgage Type
Stand Alone Refi Refinance Of Original Loan
Purchase Details
Closed on
Jul 1, 1998
Sold by
Steele Deborah A and Steele Deborah A
Bought by
Worsham Michael C
Home Financials for this Owner
Home Financials are based on the most recent Mortgage that was taken out on this home.
Original Mortgage
$64,684
Interest Rate
7.05%
Mortgage Type
FHA
Purchase Details
Closed on
Jun 5, 1997
Sold by
Steele Michael E
Bought by
Steele Deborah A
Create a Home Valuation Report for This Property
The Home Valuation Report is an in-depth analysis detailing your home's value as well as a comparison with similar homes in the area
Home Values in the Area
Average Home Value in this Area
Purchase History
| Date | Buyer | Sale Price | Title Company |
|---|---|---|---|
| Sfr3-080 Llc | -- | -- | |
| Sfr3 020 Llc | $100,000 | Integrity Title Sln Llc | |
| Growth Developments Llc | $86,000 | Integrity Title Sln Llc | |
| Worsham Michael C | -- | None Available | |
| Worsham Michael C | -- | -- | |
| Steele Deborah A | -- | -- |
Source: Public Records
Mortgage History
| Date | Status | Borrower | Loan Amount |
|---|---|---|---|
| Previous Owner | Worsham Michael C | $97,000 | |
| Previous Owner | Worsham Michael C | $64,684 |
Source: Public Records
Tax History Compared to Growth
Tax History
| Year | Tax Paid | Tax Assessment Tax Assessment Total Assessment is a certain percentage of the fair market value that is determined by local assessors to be the total taxable value of land and additions on the property. | Land | Improvement |
|---|---|---|---|---|
| 2025 | $2,094 | $31,410 | $9,220 | $22,190 |
| 2024 | $2,094 | $27,000 | $6,160 | $20,840 |
| 2023 | $1,988 | $27,000 | $6,160 | $20,840 |
| 2022 | $1,906 | $23,450 | $5,340 | $18,110 |
| 2021 | $1,873 | $23,450 | $5,340 | $18,110 |
| 2020 | $1,745 | $20,850 | $5,930 | $14,920 |
| 2019 | $1,740 | $20,850 | $5,930 | $14,920 |
| 2018 | $1,609 | $16,800 | $4,600 | $12,200 |
| 2017 | $1,582 | $16,800 | $4,600 | $12,200 |
| 2016 | $1,296 | $13,210 | $3,270 | $9,940 |
| 2015 | $1,289 | $13,210 | $3,270 | $9,940 |
| 2014 | $1,532 | $16,760 | $4,580 | $12,180 |
Source: Public Records
Map
Nearby Homes
- 3806 Waller Ave
- 765 Pardella Ave Unit A
- 711 Erskine Ave
- 715 Erskine Ave
- 514 E Dallas Ct
- 720 Erskine Ave
- 622 Kayser Ave
- 610 Kayser Ave
- 735 Dammert Ave
- 437 Hoffmeister Ave
- 522 Lagro Ave
- 252 Wachtel Ave
- 302 Waller Ave
- 241 Dammert Ave
- 300 Kayser Ave
- 363 Hoffmeister Ave
- 8626 Shoss Ave
- 944 Regina Ave
- 235 Military Rd
- 303 Weiss Ave
- 710 Reed Ave
- 714 Reed Ave
- 716 Reed Ave
- 708 Reed Ave
- 718 Reed Ave
- 711 Pardella Ave
- 713 Pardella Ave
- 709 Pardella Ave
- 3724 Bayless Ave
- 3720 Bayless Ave
- 3728 Bayless Ave
- 720 Reed Ave
- 707 Pardella Ave
- 3716 Bayless Ave
- 719 Pardella Ave
- 711 Reed Ave
- 3712 Bayless Ave
- 3730 Bayless Ave
- 713 Reed Ave
- 709 Reed Ave