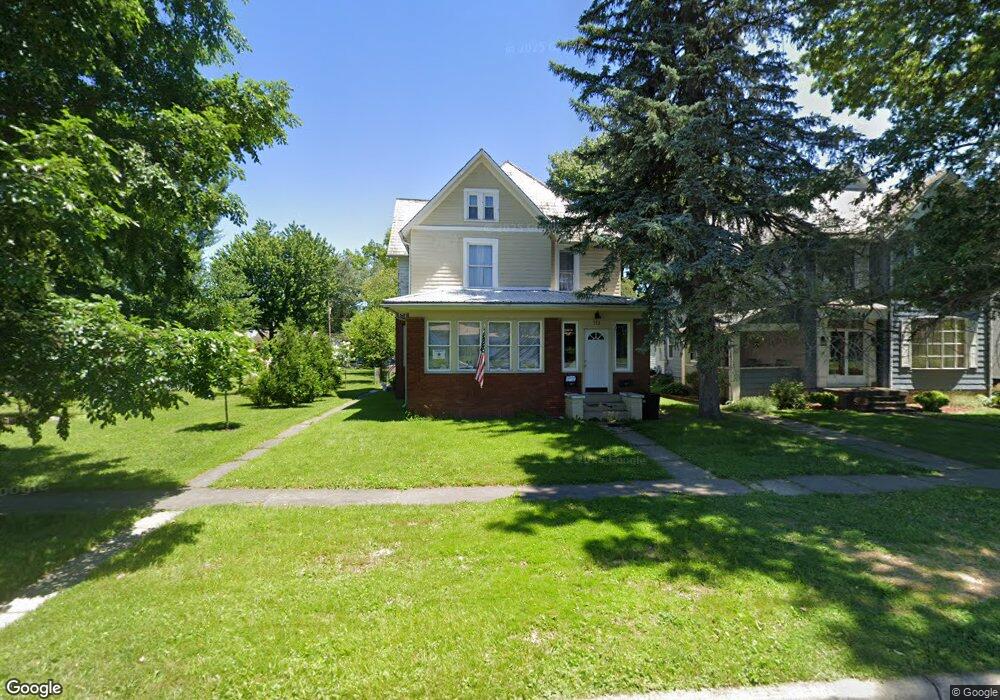
712 Rogers St Bucyrus, OH 44820
Estimated Value: $152,578 - $180,000
3
Beds
2
Baths
1,216
Sq Ft
$136/Sq Ft
Est. Value
About This Home
This home is located at 712 Rogers St, Bucyrus, OH 44820 and is currently estimated at $164,895, approximately $135 per square foot. 712 Rogers St is a home located in Crawford County with nearby schools including Bucyrus Elementary School, Bucyrus Secondary School, and CENTER FOR AUTISM / DYSLEXIA - BUCYRUS.
Ownership History
Date
Name
Owned For
Owner Type
Purchase Details
Closed on
May 30, 2019
Current Estimated Value
Purchase Details
Closed on
Nov 21, 2014
Sold by
Hout Gregory D
Bought by
Hout Ellen K
Purchase Details
Closed on
Oct 24, 2008
Sold by
Blankenship Carl J
Bought by
Hout Gregory D and Hout Ellen K
Home Financials for this Owner
Home Financials are based on the most recent Mortgage that was taken out on this home.
Original Mortgage
$43,200
Interest Rate
5.94%
Mortgage Type
New Conventional
Purchase Details
Closed on
Aug 14, 2006
Sold by
Postell Kevin L
Bought by
Blankenship Carl J
Purchase Details
Closed on
Sep 21, 2005
Sold by
Blankenship Carl J
Bought by
Postell Kevin L
Create a Home Valuation Report for This Property
The Home Valuation Report is an in-depth analysis detailing your home's value as well as a comparison with similar homes in the area
Home Values in the Area
Average Home Value in this Area
Purchase History
| Date | Buyer | Sale Price | Title Company |
|---|---|---|---|
| -- | -- | -- | |
| Hout Ellen K | -- | None Available | |
| Hout Gregory D | $54,000 | -- | |
| Blankenship Carl J | -- | -- | |
| Postell Kevin L | -- | -- |
Source: Public Records
Mortgage History
| Date | Status | Borrower | Loan Amount |
|---|---|---|---|
| Previous Owner | Hout Gregory D | $43,200 |
Source: Public Records
Tax History Compared to Growth
Tax History
| Year | Tax Paid | Tax Assessment Tax Assessment Total Assessment is a certain percentage of the fair market value that is determined by local assessors to be the total taxable value of land and additions on the property. | Land | Improvement |
|---|---|---|---|---|
| 2024 | $1,813 | $40,190 | $4,900 | $35,290 |
| 2023 | $1,813 | $32,730 | $3,730 | $29,000 |
| 2022 | $1,746 | $32,730 | $3,730 | $29,000 |
| 2021 | $1,742 | $32,730 | $3,730 | $29,000 |
| 2020 | $1,575 | $28,040 | $3,730 | $24,310 |
| 2019 | $1,610 | $28,040 | $3,730 | $24,310 |
| 2018 | $1,603 | $28,040 | $3,730 | $24,310 |
| 2017 | $1,242 | $20,970 | $3,730 | $17,240 |
| 2016 | $1,204 | $20,970 | $3,730 | $17,240 |
| 2015 | $1,187 | $20,970 | $3,730 | $17,240 |
| 2014 | $1,182 | $20,970 | $3,730 | $17,240 |
| 2013 | $1,182 | $20,970 | $3,730 | $17,240 |
Source: Public Records
Map
Nearby Homes
- 346 Hopley Ave
- 823 S Walnut St
- 550 S Walnut St
- 419 Short St
- 622 S Poplar St
- 706 E Oakwood Ave
- 427 E Southern Ave
- 444 Woodlawn Ave
- 221 W Oakwood Ave
- 531 S Poplar St
- 900 S Spring St
- 1021 S Sandusky Ave
- 325 W Liberty St
- 520 E Warren St
- 314 S Spring St
- 603 Kaler Ave
- 319 Sheckler St
- 317 S Spring St
- 412 E Rensselaer St
- 1211 S Sandusky Ave