Estimated Value: $111,000 - $161,000
2
Beds
2
Baths
1,056
Sq Ft
$134/Sq Ft
Est. Value
About This Home
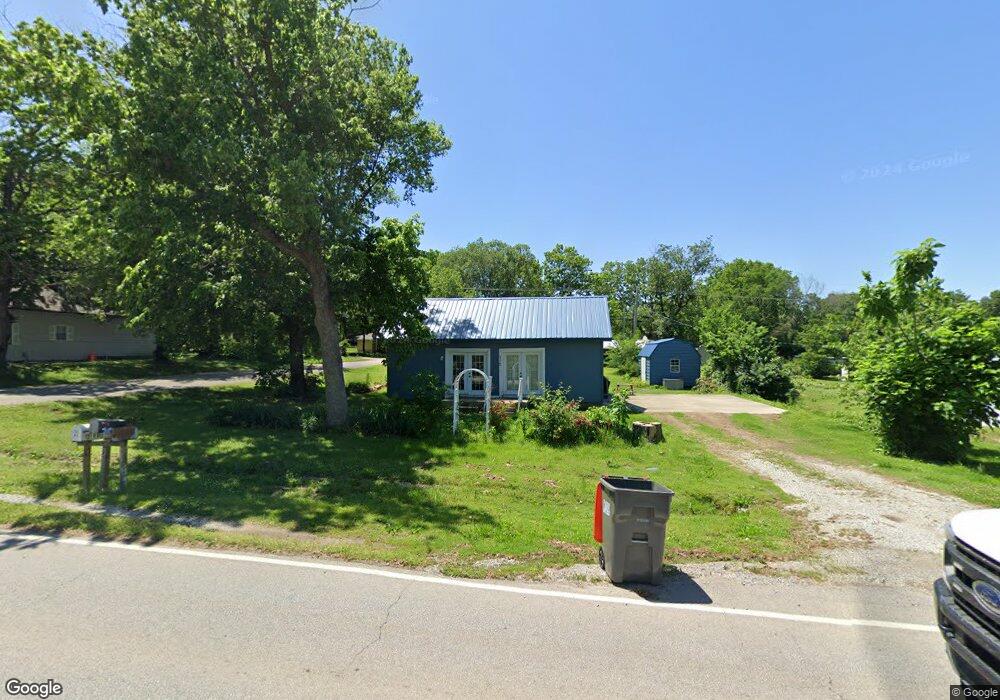
This home is located at 712 S Broadway St, Grove, OK 74344 and is currently estimated at $141,029, approximately $133 per square foot. 712 S Broadway St is a home located in Delaware County with nearby schools including Grove Lower Elementary School, Grove Upper Elementary School, and Grove Middle School.
Ownership History
Date
Name
Owned For
Owner Type
Purchase Details
Closed on
May 1, 2023
Sold by
Marks Rita
Bought by
Evans Jason and Thomas Steven
Current Estimated Value
Home Financials for this Owner
Home Financials are based on the most recent Mortgage that was taken out on this home.
Original Mortgage
$74,400
Outstanding Balance
$72,332
Interest Rate
6.6%
Mortgage Type
New Conventional
Estimated Equity
$68,697
Purchase Details
Closed on
Jun 18, 2015
Sold by
Husong Robert
Bought by
Marks Ria
Purchase Details
Closed on
May 2, 2003
Sold by
Grand Savings Bank
Purchase Details
Closed on
Feb 24, 2003
Sold by
Anderson Michael and Anderson Danette
Purchase Details
Closed on
Aug 3, 1993
Sold by
Vaught Issic Allen
Purchase Details
Closed on
Jun 22, 1990
Sold by
Zimmerman Agnes Eileen
Create a Home Valuation Report for This Property
The Home Valuation Report is an in-depth analysis detailing your home's value as well as a comparison with similar homes in the area
Home Values in the Area
Average Home Value in this Area
Purchase History
| Date | Buyer | Sale Price | Title Company |
|---|---|---|---|
| Evans Jason | $93,000 | Apex Title | |
| Marks Ria | $25,000 | None Available | |
| -- | $15,000 | -- | |
| -- | -- | -- | |
| -- | -- | -- | |
| -- | -- | -- |
Source: Public Records
Mortgage History
| Date | Status | Borrower | Loan Amount |
|---|---|---|---|
| Open | Evans Jason | $74,400 |
Source: Public Records
Tax History Compared to Growth
Tax History
| Year | Tax Paid | Tax Assessment Tax Assessment Total Assessment is a certain percentage of the fair market value that is determined by local assessors to be the total taxable value of land and additions on the property. | Land | Improvement |
|---|---|---|---|---|
| 2025 | $879 | $10,695 | $2,731 | $7,964 |
| 2024 | $866 | $10,695 | $1,869 | $8,826 |
| 2023 | $866 | $6,431 | $1,163 | $5,268 |
| 2022 | $0 | $6,430 | $1,150 | $5,280 |
| 2021 | $1,233 | $6,243 | $1,150 | $5,093 |
| 2020 | $0 | $5,885 | $1,150 | $4,735 |
| 2019 | $0 | $5,747 | $1,150 | $4,597 |
| 2018 | $0 | $5,605 | $1,150 | $4,455 |
| 2017 | $0 | $3,704 | $1,150 | $2,554 |
| 2016 | $0 | $3,491 | $1,150 | $2,341 |
| 2015 | $305 | $3,535 | $1,150 | $2,385 |
| 2014 | $300 | $3,456 | $1,035 | $2,421 |
Source: Public Records
Map
Nearby Homes
- 708 S Broadway St
- 900 S Broadway St
- 904 S Broadway St
- 717 S Spring St Unit 1,2,3
- 717 S Spring St
- 903 S Spring St
- 906 S Broadway St
- 723 S Spring St
- 121 W 9th St
- 705 S Broadway St
- 901 S Broadway St
- 915 S Broadway St
- 914 S Broadway St
- 702 S Broadway St
- 903 S Broadway St
- 913 S Spring St
- 120 W 7th St
- 916 S Broadway St
- 716 S Spring St
- 900 S Spring St