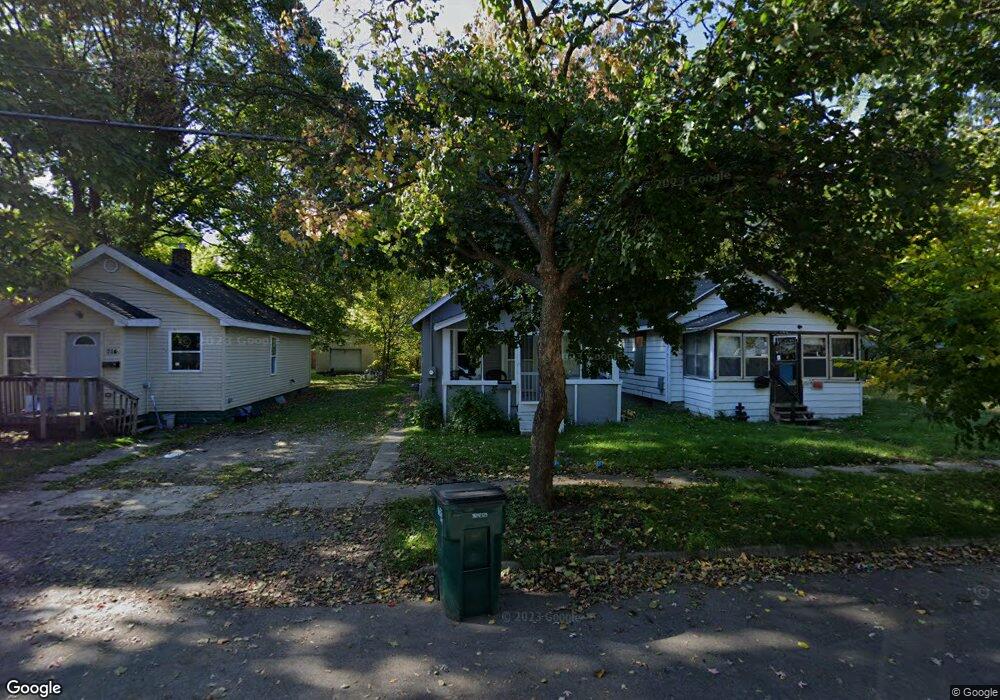
712 S Hayford Ave Lansing, MI 48912
Fairview Area NeighborhoodEstimated Value: $61,000 - $90,000
2
Beds
1
Bath
594
Sq Ft
$128/Sq Ft
Est. Value
About This Home
This home is located at 712 S Hayford Ave, Lansing, MI 48912 and is currently estimated at $75,739, approximately $127 per square foot. 712 S Hayford Ave is a home located in Ingham County with nearby schools including Pattengill Academy, Riddle Elementary School, and Eastern Lansing High School.
Ownership History
Date
Name
Owned For
Owner Type
Purchase Details
Closed on
Oct 24, 2022
Sold by
Eb Properties Iii Llc
Bought by
Hardman Holding Company Llc
Current Estimated Value
Home Financials for this Owner
Home Financials are based on the most recent Mortgage that was taken out on this home.
Original Mortgage
$58,990
Outstanding Balance
$57,091
Interest Rate
6.92%
Mortgage Type
Seller Take Back
Estimated Equity
$18,648
Purchase Details
Closed on
Aug 24, 2022
Sold by
Jonathan Hibbs
Bought by
Eb Properties Iii
Purchase Details
Closed on
Nov 8, 2021
Sold by
Eb Properties Iii
Bought by
Hibbs Jonathan
Purchase Details
Closed on
Apr 21, 2021
Sold by
Allen Joyce Lynn
Bought by
Home Buying Investors
Purchase Details
Closed on
May 30, 2018
Sold by
Glavez Leslkie
Bought by
Allen Joyce Lynn
Purchase Details
Closed on
Jul 24, 2006
Sold by
Dela Torre Juan C
Bought by
Galvez Leslie
Purchase Details
Closed on
Jul 17, 2006
Sold by
Benavides Benjamin L and Benavides Maria H
Bought by
Dela Torre Juan C
Create a Home Valuation Report for This Property
The Home Valuation Report is an in-depth analysis detailing your home's value as well as a comparison with similar homes in the area
Home Values in the Area
Average Home Value in this Area
Purchase History
| Date | Buyer | Sale Price | Title Company |
|---|---|---|---|
| Hardman Holding Company Llc | $64,990 | Elevate Title | |
| Eb Properties Iii | -- | -- | |
| Hibbs Jonathan | $74,900 | None Listed On Document | |
| Eb Properties Iii Llc | -- | None Listed On Document | |
| Williams Ebony | -- | None Listed On Document | |
| Home Buying Investors | $20,000 | None Available | |
| Allen Joyce Lynn | -- | None Available | |
| Galvez Leslie | -- | None Available | |
| Dela Torre Juan C | $10,000 | None Available |
Source: Public Records
Mortgage History
| Date | Status | Borrower | Loan Amount |
|---|---|---|---|
| Open | Hardman Holding Company Llc | $58,990 |
Source: Public Records
Tax History Compared to Growth
Tax History
| Year | Tax Paid | Tax Assessment Tax Assessment Total Assessment is a certain percentage of the fair market value that is determined by local assessors to be the total taxable value of land and additions on the property. | Land | Improvement |
|---|---|---|---|---|
| 2025 | $1,967 | $34,500 | $3,500 | $31,000 |
| 2024 | $16 | $25,100 | $3,500 | $21,600 |
| 2023 | $2,546 | $21,700 | $3,500 | $18,200 |
| 2022 | $1,499 | $18,100 | $2,800 | $15,300 |
| 2021 | $919 | $15,800 | $2,800 | $13,000 |
| 2020 | $1,590 | $15,300 | $2,800 | $12,500 |
| 2019 | $846 | $13,100 | $2,800 | $10,300 |
| 2018 | $862 | $10,300 | $2,800 | $7,500 |
| 2017 | $828 | $10,300 | $2,800 | $7,500 |
| 2016 | $622 | $10,100 | $2,800 | $7,300 |
| 2015 | $622 | $9,900 | $5,538 | $4,362 |
| 2014 | $622 | $9,800 | $5,538 | $4,262 |
Source: Public Records
Map
Nearby Homes
- 727 S Magnolia Ave
- 624 S Hayford Ave
- 701 S Fairview Ave
- 629 S Foster Ave
- 513 S Hayford Ave
- 528 S Fairview Ave
- 517 S Clemens Ave
- 515 S Clemens Ave
- 425 S Hayford Ave
- 2508 Marcus St
- 412 S Hayford Ave
- 426 S Francis Ave
- 1115 Regent St
- 607 Shepard St Unit 2
- 1118 Regent St
- 1119 Leslie St
- 305 S Magnolia Ave
- 312 S Francis Ave
- 239 S Fairview Ave
- 1225 Regent St
- 708 S Hayford Ave
- 714 S Hayford Ave
- 706 S Hayford Ave
- 704 S Hayford Ave
- 724 S Hayford Ave
- 713 S Magnolia Ave
- 719 S Magnolia Ave
- 707 S Magnolia Ave
- 726 S Hayford Ave
- 721 S Magnolia Ave
- 703 S Magnolia Ave
- 730 S Hayford Ave
- 717 S Hayford Ave
- 725 S Hayford Ave
- 731 S Magnolia Ave
- 648 S Hayford Ave
- 729 S Hayford Ave
- 651 S Magnolia Ave
- 653 S Hayford Ave
- 644 S Hayford Ave