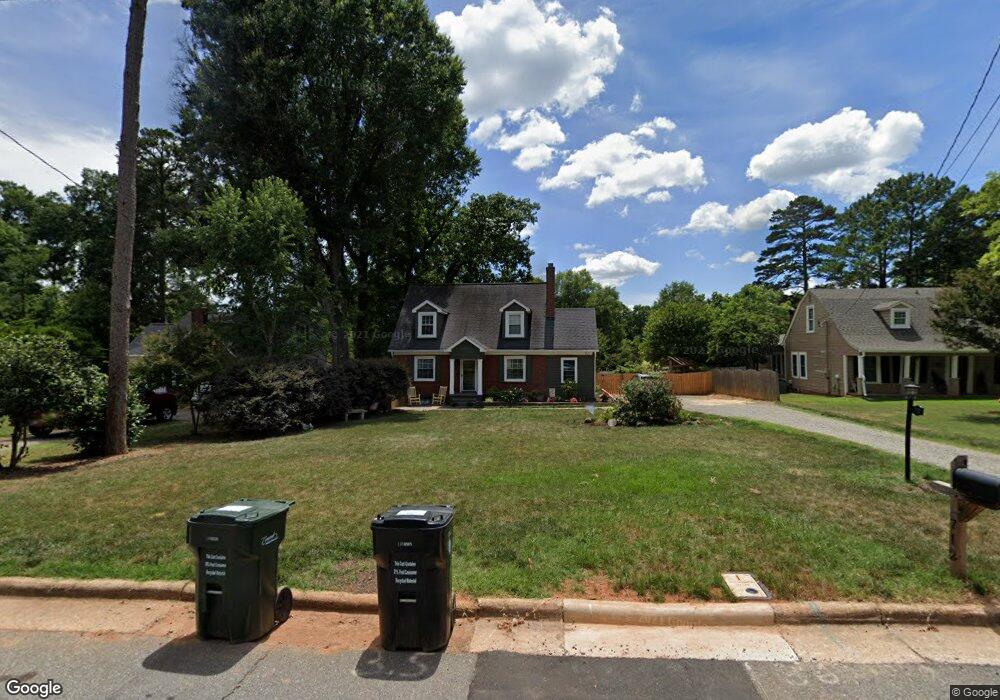
712 Spring St SW Concord, NC 28025
Estimated Value: $354,000 - $403,920
3
Beds
3
Baths
1,796
Sq Ft
$207/Sq Ft
Est. Value
About This Home
This home is located at 712 Spring St SW, Concord, NC 28025 and is currently estimated at $371,480, approximately $206 per square foot. 712 Spring St SW is a home located in Cabarrus County with nearby schools including R Brown Mcallister STEMElementary, Concord Middle School, and Concord High School.
Ownership History
Date
Name
Owned For
Owner Type
Purchase Details
Closed on
Jul 20, 2021
Sold by
Fowlie Catherine and Fowlie Robert Catherine
Bought by
Robert Michel P
Current Estimated Value
Home Financials for this Owner
Home Financials are based on the most recent Mortgage that was taken out on this home.
Original Mortgage
$200,000
Outstanding Balance
$181,244
Interest Rate
2.96%
Mortgage Type
New Conventional
Estimated Equity
$190,236
Purchase Details
Closed on
Jul 3, 2021
Sold by
Fowlie Catherine and Fowlie Robert Michel
Bought by
Robert Catherine C and Robert Michel P
Home Financials for this Owner
Home Financials are based on the most recent Mortgage that was taken out on this home.
Original Mortgage
$200,000
Outstanding Balance
$181,244
Interest Rate
2.96%
Mortgage Type
New Conventional
Estimated Equity
$190,236
Purchase Details
Closed on
Jun 7, 2010
Sold by
Fowlie David
Bought by
Fowlie Catherine
Purchase Details
Closed on
Apr 12, 2007
Sold by
Bennett Blair and Bennett Starr
Bought by
Fowlie David and Fowlie Catherine
Home Financials for this Owner
Home Financials are based on the most recent Mortgage that was taken out on this home.
Original Mortgage
$123,400
Interest Rate
6.15%
Mortgage Type
Purchase Money Mortgage
Purchase Details
Closed on
Dec 1, 1987
Bought by
Bennett Blair D and Bennett Starr H
Purchase Details
Closed on
Jul 1, 1987
Purchase Details
Closed on
Apr 1, 1987
Create a Home Valuation Report for This Property
The Home Valuation Report is an in-depth analysis detailing your home's value as well as a comparison with similar homes in the area
Home Values in the Area
Average Home Value in this Area
Purchase History
| Date | Buyer | Sale Price | Title Company |
|---|---|---|---|
| Robert Michel P | -- | None Listed On Document | |
| Robert Catherine C | -- | None Available | |
| Fowlie Catherine | -- | None Available | |
| Fowlie David | $154,500 | None Available | |
| Bennett Blair D | $78,000 | -- | |
| -- | $41,000 | -- | |
| -- | $35,000 | -- |
Source: Public Records
Mortgage History
| Date | Status | Borrower | Loan Amount |
|---|---|---|---|
| Open | Robert Michel P | $200,000 | |
| Closed | Robert Catherine C | $200,000 | |
| Previous Owner | Fowlie David | $123,400 |
Source: Public Records
Tax History
| Year | Tax Paid | Tax Assessment Tax Assessment Total Assessment is a certain percentage of the fair market value that is determined by local assessors to be the total taxable value of land and additions on the property. | Land | Improvement |
|---|---|---|---|---|
| 2025 | $3,704 | $371,850 | $88,000 | $283,850 |
| 2024 | $3,704 | $371,850 | $88,000 | $283,850 |
| 2023 | $2,953 | $242,830 | $40,700 | $202,130 |
| 2022 | $2,953 | $185,460 | $40,700 | $144,760 |
| 2021 | $6 | $185,460 | $40,700 | $144,760 |
| 2020 | $2,043 | $167,470 | $40,700 | $126,770 |
| 2019 | $1,707 | $139,940 | $35,200 | $104,740 |
| 2018 | $1,679 | $139,940 | $35,200 | $104,740 |
| 2017 | $1,651 | $139,940 | $35,200 | $104,740 |
| 2016 | $980 | $134,730 | $35,200 | $99,530 |
| 2015 | $1,590 | $134,730 | $35,200 | $99,530 |
| 2014 | $1,590 | $134,730 | $35,200 | $99,530 |
Source: Public Records
Map
Nearby Homes
- 569 Union St S
- 571 Union St S
- 686 Elizabeth St SW
- 782 Union St S
- 79 Fryling Ave SW
- 783 Union St S
- 80 Pounds Ave SW
- 111 Marshdale Ave SW
- 60 Patton Ct SE
- 745 Carolyn Dr SE
- 671 Sedgefield St SW
- 921 Pineridge St SE
- 269 Fryling Ave SW
- 3560-C U S 601
- 267 Ikerd Dr SE
- 271 Ikerd Dr SE
- 94 Cumberland Ct SW
- 374 Union St S
- 229 Boger Ct SW
- 29 Plott Dr SW
- 708 Spring St SW
- 720 Spring St SW
- 702 Spring St SW
- 703 Elizabeth St SW
- 711 Elizabeth St SW
- 695 Elizabeth St SW
- 726 Spring St SW
- 711 Spring St SW
- 707 Spring St SW
- 700 Spring St SW
- 700 Spring St SW Unit LTS 19.20
- 715 Spring St SW
- 717 Elizabeth St SW
- 689 Elizabeth St SW
- 701 Spring St SW
- 692 Spring St SW
- 727 Spring St SW
- 723 Elizabeth St SW
- 683 Elizabeth St SW
- 695 Spring St SW
Your Personal Tour Guide
Ask me questions while you tour the home.