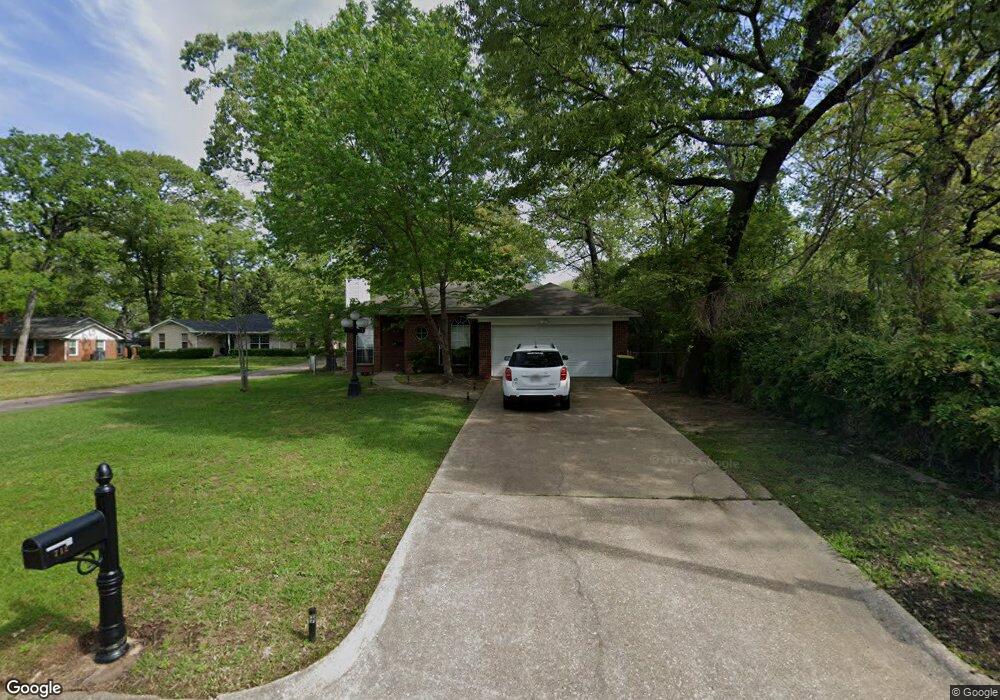
712 W 27th St Texarkana, TX 75503
Estimated Value: $131,906 - $181,000
--
Bed
--
Bath
1,087
Sq Ft
$146/Sq Ft
Est. Value
About This Home
This home is located at 712 W 27th St, Texarkana, TX 75503 and is currently estimated at $158,727, approximately $146 per square foot. 712 W 27th St is a home located in Bowie County with nearby schools including Highland Park Elementary School, Texas Middle School, and Texas High School.
Ownership History
Date
Name
Owned For
Owner Type
Purchase Details
Closed on
Sep 30, 2010
Sold by
Hall Alice E and Hall Betty
Bought by
Tilton Blake Douglas
Current Estimated Value
Home Financials for this Owner
Home Financials are based on the most recent Mortgage that was taken out on this home.
Original Mortgage
$91,764
Outstanding Balance
$60,779
Interest Rate
4.5%
Mortgage Type
FHA
Estimated Equity
$97,948
Create a Home Valuation Report for This Property
The Home Valuation Report is an in-depth analysis detailing your home's value as well as a comparison with similar homes in the area
Home Values in the Area
Average Home Value in this Area
Purchase History
| Date | Buyer | Sale Price | Title Company |
|---|---|---|---|
| Tilton Blake Douglas | -- | Twin City Title Co |
Source: Public Records
Mortgage History
| Date | Status | Borrower | Loan Amount |
|---|---|---|---|
| Open | Tilton Blake Douglas | $91,764 |
Source: Public Records
Tax History Compared to Growth
Tax History
| Year | Tax Paid | Tax Assessment Tax Assessment Total Assessment is a certain percentage of the fair market value that is determined by local assessors to be the total taxable value of land and additions on the property. | Land | Improvement |
|---|---|---|---|---|
| 2025 | $3,514 | $153,508 | $12,000 | $141,508 |
| 2024 | $3,514 | $148,412 | $12,000 | $136,412 |
| 2023 | $3,343 | $141,192 | $12,000 | $129,192 |
| 2022 | $3,063 | $128,318 | $12,000 | $116,318 |
| 2021 | $2,719 | $106,339 | $12,000 | $94,339 |
| 2020 | $2,625 | $102,116 | $12,000 | $90,116 |
| 2019 | $2,617 | $98,091 | $12,000 | $86,091 |
| 2018 | $2,560 | $95,989 | $12,000 | $83,989 |
| 2017 | $2,513 | $94,454 | $12,000 | $82,454 |
| 2016 | $2,453 | $92,225 | $12,000 | $80,225 |
| 2015 | $2,348 | $91,485 | $12,000 | $79,485 |
| 2014 | $2,348 | $90,765 | $12,000 | $78,765 |
Source: Public Records
Map
Nearby Homes