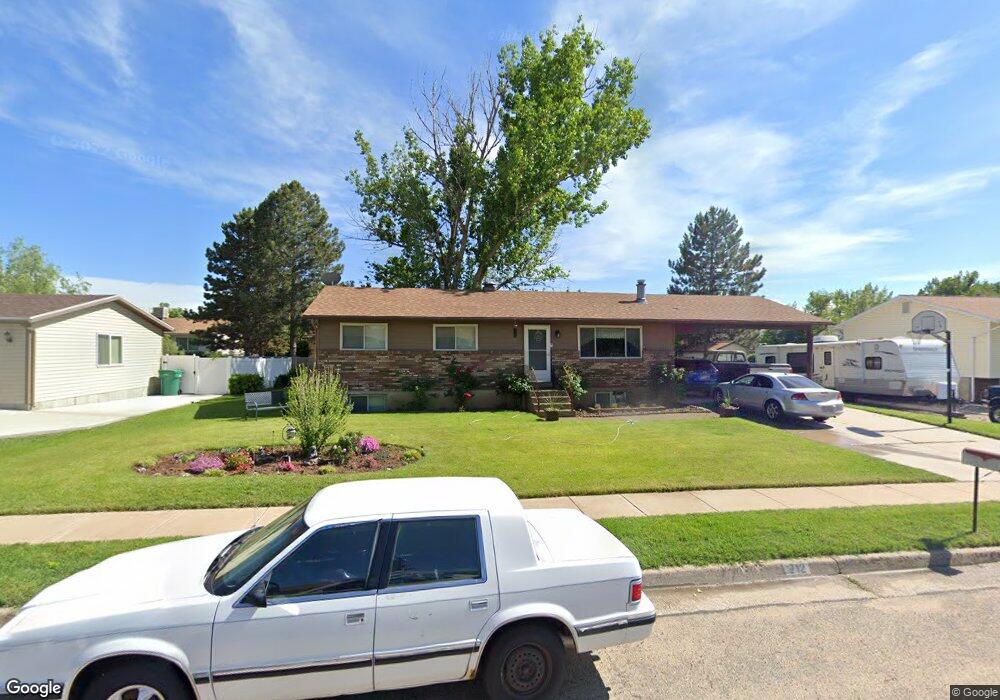
712 W 725 N Clearfield, UT 84015
Estimated Value: $407,000 - $423,000
5
Beds
2
Baths
1,829
Sq Ft
$226/Sq Ft
Est. Value
About This Home
This home is located at 712 W 725 N, Clearfield, UT 84015 and is currently estimated at $413,228, approximately $225 per square foot. 712 W 725 N is a home located in Davis County with nearby schools including Doxey School, North Davis Junior High School, and Clearfield High School.
Ownership History
Date
Name
Owned For
Owner Type
Purchase Details
Closed on
Apr 6, 2022
Sold by
Opendoor Property C Llc
Bought by
Tadeo Rosaura and Defajardo Jose
Current Estimated Value
Purchase Details
Closed on
Mar 14, 2022
Sold by
Hall Lela M
Bought by
Opendoor Property C Llc
Purchase Details
Closed on
Nov 18, 2005
Sold by
Hall Lela M and Hall Lela M Camper
Bought by
Hall Lela M
Home Financials for this Owner
Home Financials are based on the most recent Mortgage that was taken out on this home.
Original Mortgage
$85,240
Interest Rate
5.93%
Mortgage Type
New Conventional
Purchase Details
Closed on
Nov 13, 1996
Sold by
Camper Charles L
Bought by
Hall Lela M Camper
Create a Home Valuation Report for This Property
The Home Valuation Report is an in-depth analysis detailing your home's value as well as a comparison with similar homes in the area
Home Values in the Area
Average Home Value in this Area
Purchase History
| Date | Buyer | Sale Price | Title Company |
|---|---|---|---|
| Tadeo Rosaura | -- | -- | |
| Opendoor Property C Llc | -- | None Listed On Document | |
| Opendoor Property C Llc | -- | None Listed On Document | |
| Hall Lela M | -- | -- | |
| Hall Lela M Camper | -- | -- |
Source: Public Records
Mortgage History
| Date | Status | Borrower | Loan Amount |
|---|---|---|---|
| Previous Owner | Hall Lela M | $85,240 |
Source: Public Records
Tax History Compared to Growth
Tax History
| Year | Tax Paid | Tax Assessment Tax Assessment Total Assessment is a certain percentage of the fair market value that is determined by local assessors to be the total taxable value of land and additions on the property. | Land | Improvement |
|---|---|---|---|---|
| 2025 | $2,363 | $211,750 | $73,665 | $138,085 |
| 2024 | $2,279 | $205,700 | $70,417 | $135,283 |
| 2023 | $2,119 | $351,000 | $112,552 | $238,448 |
| 2022 | $2,222 | $199,100 | $64,333 | $134,767 |
| 2021 | $1,950 | $264,000 | $69,058 | $194,942 |
| 2020 | $1,703 | $229,000 | $58,200 | $170,800 |
| 2019 | $1,657 | $220,000 | $60,541 | $159,459 |
| 2018 | $1,547 | $200,000 | $53,736 | $146,264 |
| 2016 | $1,333 | $90,090 | $21,509 | $68,581 |
| 2015 | $1,284 | $82,775 | $21,509 | $61,266 |
| 2014 | $1,233 | $80,519 | $21,509 | $59,010 |
| 2013 | -- | $65,577 | $26,730 | $38,847 |
Source: Public Records
Map
Nearby Homes