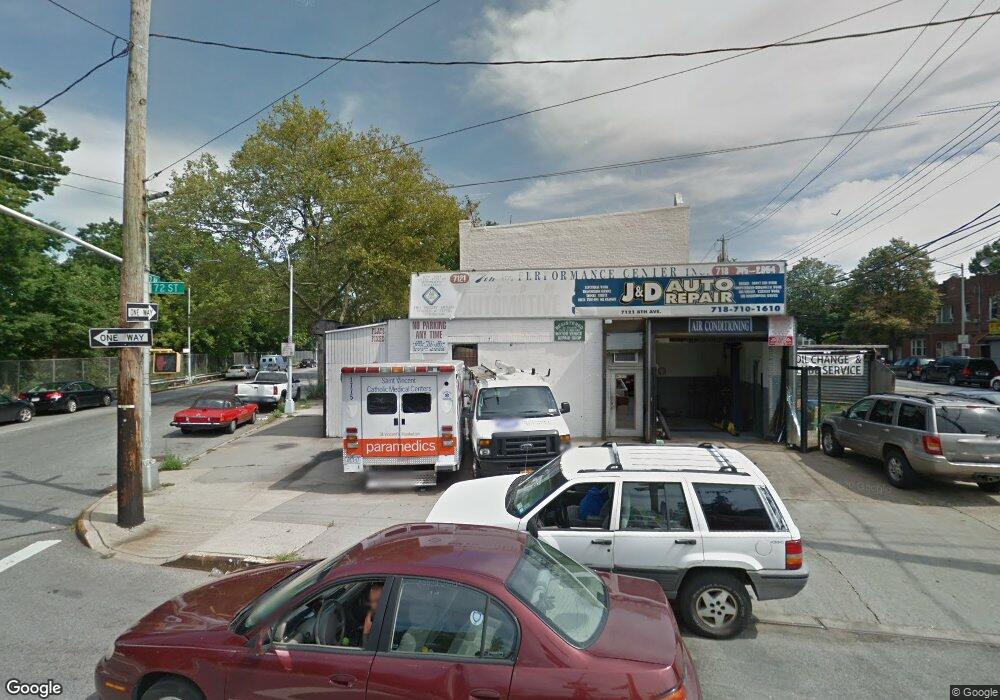
7121 7th Ave Brooklyn, NY 11228
Dyker Heights NeighborhoodEstimated Value: $512,233
Studio
--
Bath
160
Sq Ft
$3,201/Sq Ft
Est. Value
About This Home
This home is located at 7121 7th Ave, Brooklyn, NY 11228 and is currently estimated at $512,233, approximately $3,201 per square foot. 7121 7th Ave is a home located in Kings County with nearby schools including Junior High School 259 William McKinley, Fort Hamilton High School, and St Ephrem School.
Ownership History
Date
Name
Owned For
Owner Type
Purchase Details
Closed on
Nov 1, 2024
Sold by
Jensen Dag David
Bought by
7121 Sun Llc
Current Estimated Value
Home Financials for this Owner
Home Financials are based on the most recent Mortgage that was taken out on this home.
Original Mortgage
$450,000
Outstanding Balance
$444,556
Interest Rate
6.08%
Mortgage Type
Purchase Money Mortgage
Estimated Equity
$67,677
Purchase Details
Closed on
Nov 14, 1995
Sold by
Jensen Walter
Bought by
Jensen Dag David
Create a Home Valuation Report for This Property
The Home Valuation Report is an in-depth analysis detailing your home's value as well as a comparison with similar homes in the area
Home Values in the Area
Average Home Value in this Area
Purchase History
| Date | Buyer | Sale Price | Title Company |
|---|---|---|---|
| 7121 Sun Llc | $500,000 | -- | |
| 7121 Sun Llc | $500,000 | -- | |
| Jensen Dag David | -- | Chicago Title Insurance Co | |
| Jensen Dag David | -- | Chicago Title Insurance Co |
Source: Public Records
Mortgage History
| Date | Status | Borrower | Loan Amount |
|---|---|---|---|
| Open | 7121 Sun Llc | $450,000 | |
| Closed | 7121 Sun Llc | $450,000 |
Source: Public Records
Tax History
| Year | Tax Paid | Tax Assessment Tax Assessment Total Assessment is a certain percentage of the fair market value that is determined by local assessors to be the total taxable value of land and additions on the property. | Land | Improvement |
|---|---|---|---|---|
| 2025 | $11,029 | $137,250 | $37,800 | $99,450 |
| 2024 | $11,029 | $126,000 | $37,800 | $88,200 |
| 2023 | $10,750 | $107,550 | $37,800 | $69,750 |
| 2022 | $10,802 | $102,150 | $37,800 | $64,350 |
| 2021 | $8,322 | $77,850 | $37,800 | $40,050 |
| 2019 | $9,594 | $110,250 | $37,800 | $72,450 |
| 2018 | $9,084 | $104,850 | $37,800 | $67,050 |
| 2017 | $8,208 | $105,300 | $37,800 | $67,500 |
| 2016 | $7,313 | $83,700 | $37,800 | $45,900 |
| 2015 | $3,454 | $70,650 | $37,800 | $32,850 |
| 2014 | $3,454 | $67,500 | $37,800 | $29,700 |
Source: Public Records
Map
Nearby Homes
- 7109 8th Ave
- 852 71st St
- 652 73rd St
- 849 73rd St
- 719 Bay Ridge Ave
- 7307 6th Ave
- 854 Bay Ridge Ave
- 653 Bay Ridge Pkwy
- 746 68th St
- 845 Bay Ridge Ave
- 847 Bay Ridge Ave
- 877 Bay Ridge Ave Unit 3H
- 571 72nd St
- 760 67th St Unit 6J
- 760 67th St Unit 3F
- 561 72nd St
- 558 72nd St
- 950 70th St Unit 1C
- 582 Bay Ridge Ave
- 946 Bay Ridge Ave