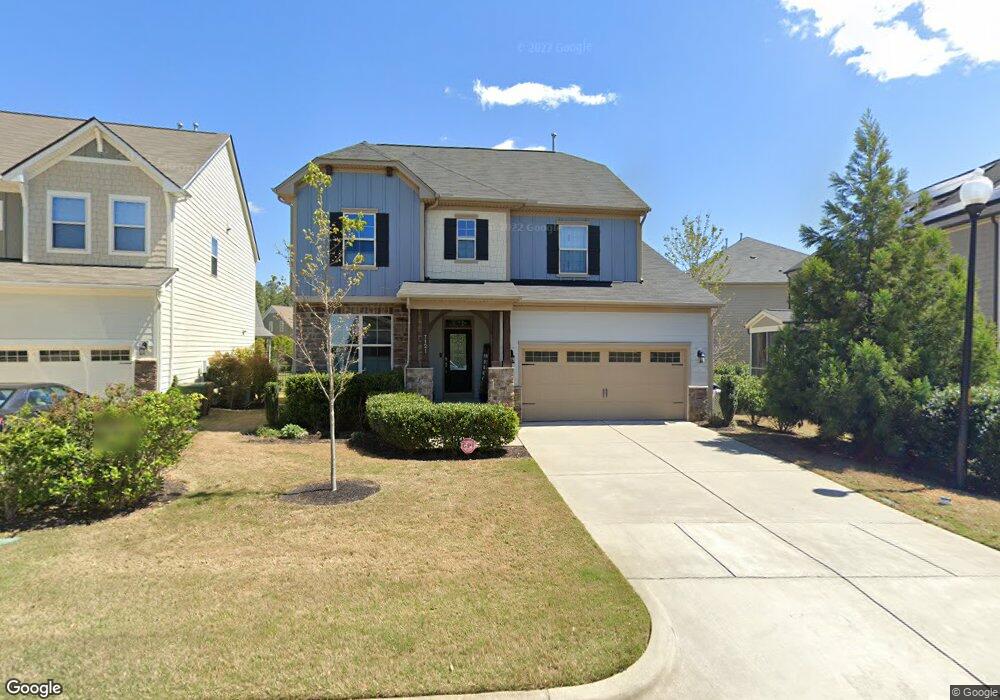
7121 Hinman Ln Apex, NC 27539
Middle Creek NeighborhoodEstimated Value: $591,000 - $646,000
5
Beds
4
Baths
2,959
Sq Ft
$209/Sq Ft
Est. Value
About This Home
This home is located at 7121 Hinman Ln, Apex, NC 27539 and is currently estimated at $619,587, approximately $209 per square foot. 7121 Hinman Ln is a home located in Wake County with nearby schools including West Lake Elementary School, West Lake Middle, and Middle Creek High.
Ownership History
Date
Name
Owned For
Owner Type
Purchase Details
Closed on
Nov 21, 2019
Sold by
Sph One Lllp
Bought by
Serra Maegan and Serra Gactano
Current Estimated Value
Home Financials for this Owner
Home Financials are based on the most recent Mortgage that was taken out on this home.
Original Mortgage
$288,000
Outstanding Balance
$254,118
Interest Rate
3.75%
Mortgage Type
New Conventional
Estimated Equity
$365,469
Purchase Details
Closed on
May 2, 2019
Sold by
Narducci Jon M and Narducci Amy M
Bought by
Sph One Lllp
Purchase Details
Closed on
Jun 4, 2014
Sold by
Standard Pacific Of The Carolinas Llc
Bought by
Narducci Jon M and Narducci Amy M
Home Financials for this Owner
Home Financials are based on the most recent Mortgage that was taken out on this home.
Original Mortgage
$253,640
Interest Rate
4.23%
Mortgage Type
New Conventional
Purchase Details
Closed on
Mar 14, 2000
Sold by
Sykes Ellan Currin
Bought by
The Chase Manhattan Bank
Create a Home Valuation Report for This Property
The Home Valuation Report is an in-depth analysis detailing your home's value as well as a comparison with similar homes in the area
Home Values in the Area
Average Home Value in this Area
Purchase History
| Date | Buyer | Sale Price | Title Company |
|---|---|---|---|
| Serra Maegan | $360,000 | Investors Title Insurance Co | |
| Sph One Lllp | $393,000 | None Available | |
| Narducci Jon M | $318,000 | None Available | |
| The Chase Manhattan Bank | $49,000 | -- |
Source: Public Records
Mortgage History
| Date | Status | Borrower | Loan Amount |
|---|---|---|---|
| Open | Serra Maegan | $288,000 | |
| Previous Owner | Narducci Jon M | $253,640 |
Source: Public Records
Tax History Compared to Growth
Tax History
| Year | Tax Paid | Tax Assessment Tax Assessment Total Assessment is a certain percentage of the fair market value that is determined by local assessors to be the total taxable value of land and additions on the property. | Land | Improvement |
|---|---|---|---|---|
| 2025 | $5,002 | $581,293 | $120,000 | $461,293 |
| 2024 | $4,894 | $581,293 | $120,000 | $461,293 |
| 2023 | $3,822 | $379,442 | $65,000 | $314,442 |
| 2022 | $3,680 | $379,442 | $65,000 | $314,442 |
| 2021 | $3,606 | $379,442 | $65,000 | $314,442 |
| 2020 | $3,625 | $379,442 | $65,000 | $314,442 |
| 2019 | $3,548 | $329,501 | $56,000 | $273,501 |
| 2018 | $3,330 | $329,501 | $56,000 | $273,501 |
| 2017 | $3,200 | $329,501 | $56,000 | $273,501 |
| 2016 | $3,152 | $329,501 | $56,000 | $273,501 |
| 2015 | $3,020 | $304,699 | $44,000 | $260,699 |
| 2014 | $1,380 | $148,700 | $44,000 | $104,700 |
Source: Public Records
Map
Nearby Homes
- 7404 Bedford Ridge Dr
- 5340 Serene Forest Dr
- 6025 Larboard Dr
- 333 Calvander Ln
- 120 Corapeake Way
- 124 Corapeake Way
- 128 Corapeake Way
- 104 Corapeake Way
- 7381 Capulin Crest Dr
- 8401 Piney Branch Dr
- 409 Wanderview Ln
- 112 Skygrove Dr
- 113 Middlegreen Place
- 129 Middlegreen Place
- 5045 Homeplace Dr
- 804 Blue Thorn Dr
- 204 Edgepine Dr
- 436 Edgepine Dr
- 3601 Lebrun Path Unit 26 Eldorado Cr
- 608 Skygrove Dr
- 7117 Hinman Ln
- 5224 Moneta Ln
- 5228 Moneta Ln
- 5220 Moneta Ln
- 7113 Hinman Ln
- 5216 Moneta Ln
- 7109 Hinman Ln
- 7120 Hinman Ln
- 7013 Dayton Ridge Dr
- 7013 Dayton Ridge Dr Unit L227
- 7009 Dayton Ridge Dr
- 7009 Dayton Ridge Dr Unit L228
- 7017 Dayton Ridge Dr
- 7017 Dayton Ridge Dr Unit L226
- 7112 Hinman Ln
- 5212 Moneta Ln
- 7021 Dayton Ridge Dr
- 7021 Dayton Ridge Dr Unit L225
- 7105 Hinman Ln
- 7005 Dayton Ridge Dr