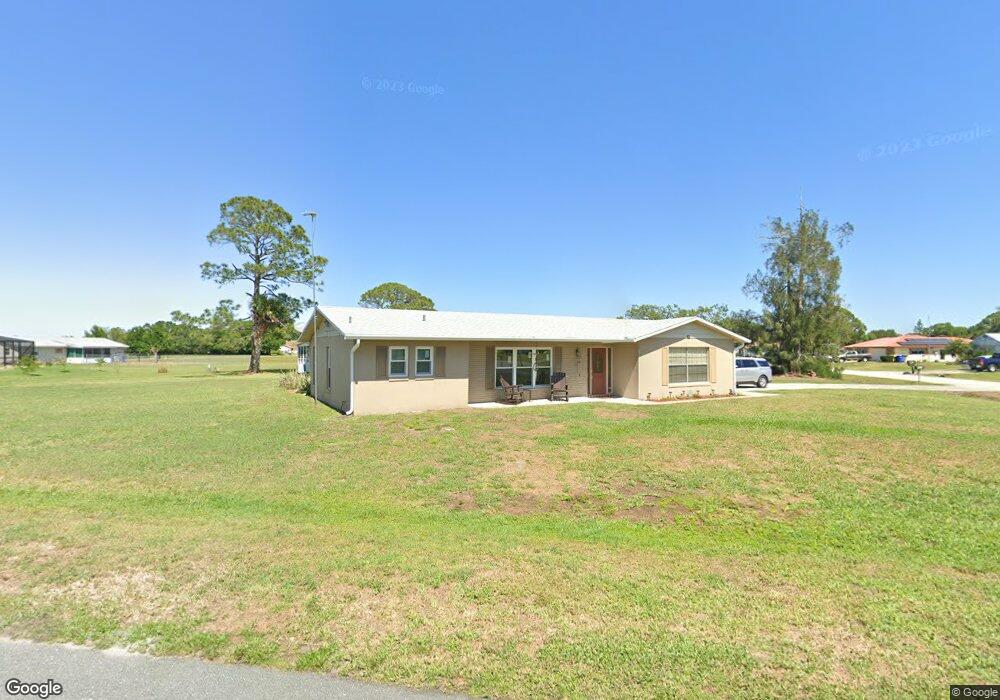
7121 Rolling Hills Rd Sebring, FL 33876
Spring Lake Village NeighborhoodEstimated Value: $227,000 - $259,000
3
Beds
2
Baths
2,154
Sq Ft
$114/Sq Ft
Est. Value
About This Home
This home is located at 7121 Rolling Hills Rd, Sebring, FL 33876 and is currently estimated at $245,265, approximately $113 per square foot. 7121 Rolling Hills Rd is a home located in Highlands County with nearby schools including Fred Wild Elementary School, Sebring High School, and Sebring Middle School.
Ownership History
Date
Name
Owned For
Owner Type
Purchase Details
Closed on
Apr 23, 2024
Sold by
Zonneveld Marcia K
Bought by
Zonneveld Marcia K and Nichols Nancy
Current Estimated Value
Purchase Details
Closed on
Aug 6, 2012
Sold by
Zonneveld Johannes C and Zonneveld Marcia K
Bought by
Zonneveld Johannes C and Zonneveld Marcia K
Purchase Details
Closed on
Nov 30, 2010
Sold by
U S Bank National Association
Bought by
Zonneveld Johannes C
Purchase Details
Closed on
Aug 17, 2010
Sold by
Milindez Clarence
Bought by
U S Bank National Association
Purchase Details
Closed on
Feb 14, 2006
Sold by
Bloom Raphael and Petrarca Kathleen A
Bought by
Milindez Clarence
Home Financials for this Owner
Home Financials are based on the most recent Mortgage that was taken out on this home.
Original Mortgage
$178,500
Interest Rate
8.91%
Mortgage Type
Unknown
Purchase Details
Closed on
Jul 7, 2005
Sold by
Bloom Bettyjo and Bloom Ralph
Bought by
Bloom Raphael and Petrarca Kathleen A
Create a Home Valuation Report for This Property
The Home Valuation Report is an in-depth analysis detailing your home's value as well as a comparison with similar homes in the area
Home Values in the Area
Average Home Value in this Area
Purchase History
| Date | Buyer | Sale Price | Title Company |
|---|---|---|---|
| Zonneveld Marcia K | $100 | None Listed On Document | |
| Zonneveld Johannes C | -- | Attorney | |
| Zonneveld Johannes C | $69,000 | Servicelink | |
| U S Bank National Association | -- | Attorney | |
| Milindez Clarence | $210,000 | Heartland Title Insurance Ag | |
| Bloom Raphael | -- | -- |
Source: Public Records
Mortgage History
| Date | Status | Borrower | Loan Amount |
|---|---|---|---|
| Previous Owner | Milindez Clarence | $178,500 |
Source: Public Records
Tax History
| Year | Tax Paid | Tax Assessment Tax Assessment Total Assessment is a certain percentage of the fair market value that is determined by local assessors to be the total taxable value of land and additions on the property. | Land | Improvement |
|---|---|---|---|---|
| 2025 | $722 | $84,929 | -- | -- |
| 2024 | -- | $82,535 | -- | -- |
| 2023 | $660 | $80,131 | $0 | $0 |
| 2022 | $638 | $77,797 | $0 | $0 |
| 2021 | $624 | $75,531 | $0 | $0 |
| 2020 | $579 | $74,488 | $0 | $0 |
| 2019 | $579 | $72,813 | $0 | $0 |
| 2018 | $572 | $71,455 | $0 | $0 |
| 2017 | $485 | $69,985 | $0 | $0 |
| 2016 | $493 | $68,546 | $0 | $0 |
| 2015 | $450 | $68,070 | $0 | $0 |
| 2014 | $442 | $0 | $0 | $0 |
Source: Public Records
Map
Nearby Homes
- 416 Dogwood Dr
- 500 Dogwood Dr
- 7217 Rolling Hills Rd
- 7109 Coral Ridge Rd
- 417 Cherry Tree Dr
- 508 Cherry Tree Dr
- 401 Cherry Tree Dr
- 425 Spring Lake Blvd
- 424 Cherry Tree Dr
- 705 Glen Mar Ct
- 7001 Woodmont Ct
- 800 Woodmont St
- 108 Oak Knolls Cir
- 116 Oak Knolls Cir
- 817 Trident Ct
- 517 Ivy Dr
- 525 Glen Mar Cir
- 516 Glen Mar Cir
- 816 Winston Dr
- 101 Voss Ct
- 7125 Rolling Hills Rd
- 7120 Coral Ridge Rd
- 7116 Coral Ridge Rd
- 7124 Coral Ridge Rd
- 7116 Rolling Hills Rd
- 7112 Coral Ridge Rd
- 7112 Coral Ridge Rd Unit LOT 3
- 7112 Rolling Hills Rd
- 7109 Rolling Hills Rd
- 7128 Coral Ridge Rd
- 601 Dogwood Ct
- 501 Dogwood Dr
- 7625 Honeysuckle Dr
- 7129 Coral Ridge Rd
- 432 Dogwood Dr
- 7104 Coral Ridge Rd
- 416 Fabber Ct
- 425 Dogwood Dr
- 7617 Honeysuckle Dr
- 7104 Rolling Hills Rd
Your Personal Tour Guide
Ask me questions while you tour the home.