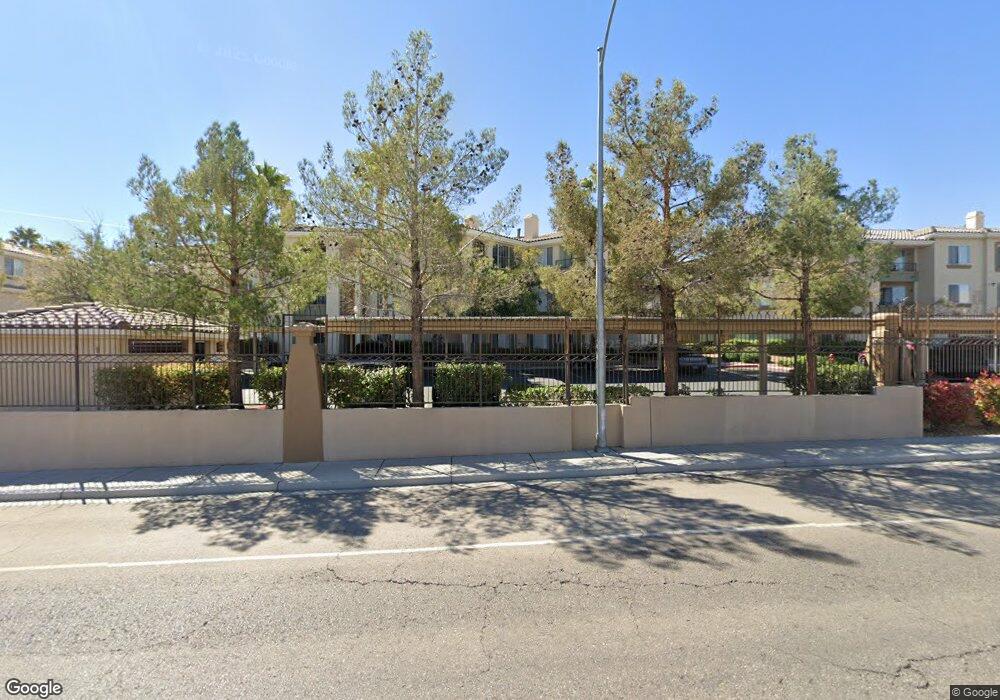
7123 S Durango Dr Unit 209 Las Vegas, NV 89113
Estimated Value: $244,373 - $250,000
2
Beds
2
Baths
943
Sq Ft
$262/Sq Ft
Est. Value
About This Home
This home is located at 7123 S Durango Dr Unit 209, Las Vegas, NV 89113 and is currently estimated at $247,343, approximately $262 per square foot. 7123 S Durango Dr Unit 209 is a home located in Clark County with nearby schools including Wayne N. Tanaka Elementary School, Wilbur & Theresa Faiss Middle School, and Sierra Vista High School.
Ownership History
Date
Name
Owned For
Owner Type
Purchase Details
Closed on
Jun 30, 2011
Sold by
Triple Y Integrity Llc
Bought by
7123 S Durango Dr #209 Trust
Current Estimated Value
Purchase Details
Closed on
Mar 9, 2011
Sold by
Reynolds Allison M
Bought by
Triple Y Integrity Llc
Purchase Details
Closed on
Aug 3, 2005
Sold by
Lynch Lema L
Bought by
Reynolds Allison M
Home Financials for this Owner
Home Financials are based on the most recent Mortgage that was taken out on this home.
Original Mortgage
$159,200
Interest Rate
5.99%
Mortgage Type
Unknown
Purchase Details
Closed on
Feb 27, 2003
Sold by
Rhodes Ranch Lp
Bought by
Lynch Lema L
Home Financials for this Owner
Home Financials are based on the most recent Mortgage that was taken out on this home.
Original Mortgage
$113,795
Interest Rate
5.93%
Mortgage Type
FHA
Create a Home Valuation Report for This Property
The Home Valuation Report is an in-depth analysis detailing your home's value as well as a comparison with similar homes in the area
Home Values in the Area
Average Home Value in this Area
Purchase History
| Date | Buyer | Sale Price | Title Company |
|---|---|---|---|
| 7123 S Durango Dr #209 Trust | -- | None Available | |
| Triple Y Integrity Llc | $62,000 | Fidelity National Title Las | |
| Reynolds Allison M | $199,000 | Fidelity National Title | |
| Lynch Lema L | $116,155 | Commerce Title |
Source: Public Records
Mortgage History
| Date | Status | Borrower | Loan Amount |
|---|---|---|---|
| Previous Owner | Reynolds Allison M | $159,200 | |
| Previous Owner | Lynch Lema L | $113,795 |
Source: Public Records
Tax History Compared to Growth
Tax History
| Year | Tax Paid | Tax Assessment Tax Assessment Total Assessment is a certain percentage of the fair market value that is determined by local assessors to be the total taxable value of land and additions on the property. | Land | Improvement |
|---|---|---|---|---|
| 2025 | $1,078 | $54,085 | $24,500 | $29,585 |
| 2024 | $998 | $54,085 | $24,500 | $29,585 |
| 2023 | $998 | $51,731 | $24,500 | $27,231 |
| 2022 | $925 | $47,190 | $22,050 | $25,140 |
| 2021 | $856 | $44,229 | $19,950 | $24,279 |
| 2020 | $792 | $41,226 | $17,150 | $24,076 |
| 2019 | $743 | $39,074 | $15,050 | $24,024 |
| 2018 | $709 | $37,410 | $14,000 | $23,410 |
| 2017 | $916 | $31,233 | $7,350 | $23,883 |
| 2016 | $665 | $29,523 | $5,600 | $23,923 |
| 2015 | $662 | $26,875 | $4,900 | $21,975 |
| 2014 | $641 | $22,695 | $4,900 | $17,795 |
Source: Public Records
Map
Nearby Homes
- 7123 S Durango Dr Unit 204
- 7115 S Durango Dr Unit 207
- 7135 S Durango Dr Unit 306
- 7135 S Durango Dr Unit 106
- 7135 S Durango Dr Unit 210
- 7135 S Durango Dr Unit 314
- 7135 S Durango Dr Unit 304
- 7119 S Durango Dr Unit 113
- 7131 S Durango Dr Unit 104
- 7131 S Durango Dr Unit 109
- 7139 S Durango Dr Unit 314
- 7111 S Durango Dr Unit 305
- 7111 S Durango Dr Unit 201
- 7167 S Durango Dr Unit 206
- 8777 W Maule Ave Unit 2128
- 8777 W Maule Ave Unit 2090
- 8777 W Maule Ave Unit 1127
- 8777 W Maule Ave Unit 1123
- 8777 W Maule Ave Unit 1098
- 7143 S Durango Dr Unit 305
- 7123 S Durango Dr Unit Living room
- 7123 S Durango Dr Unit 208
- 7123 S Durango Dr Unit 307
- 7123 S Durango Dr Unit 110
- 7123 S Durango Dr Unit 207
- 7123 S Durango Dr Unit 313
- 7123 S Durango Dr Unit 211
- 7123 S Durango Dr Unit 201
- 7123 S Durango Dr Unit 108
- 7123 S Durango Dr Unit 113
- 7123 S Durango Dr Unit 205
- 7123 S Durango Dr Unit 111
- 7123 S Durango Dr Unit 303
- 7123 S Durango Dr Unit 105
- 7123 S Durango Dr Unit 311
- 7123 S Durango Dr Unit 312
- 7123 S Durango Dr Unit 305
- 7123 S Durango Dr Unit 212
- 7123 S Durango Dr Unit 107
- 7123 S Durango Dr Unit 214