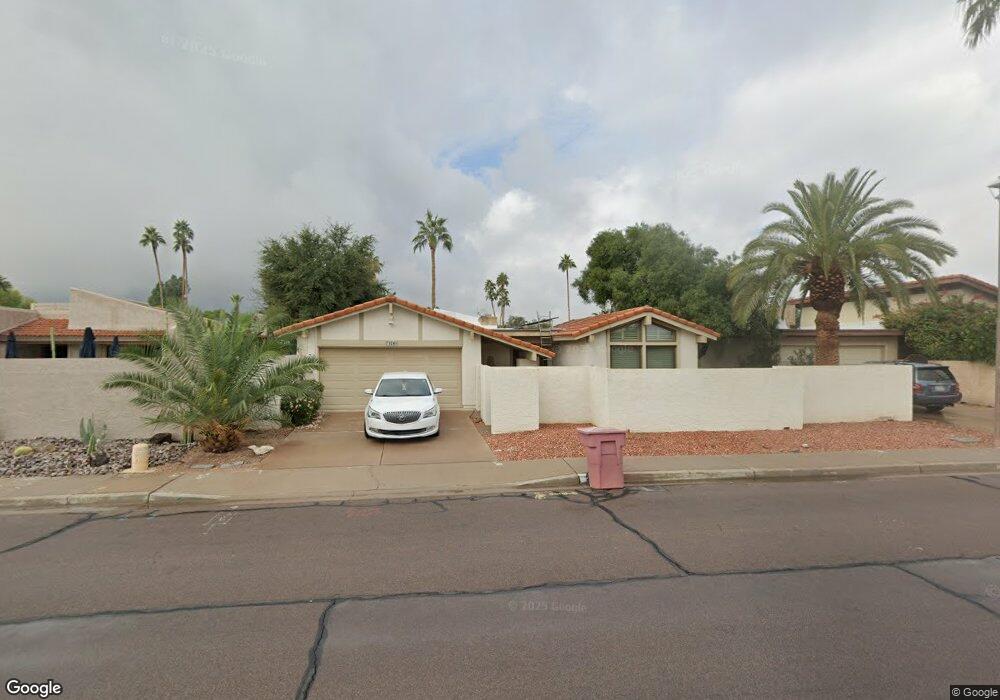
7124 N Via de Alegria Scottsdale, AZ 85258
McCormick Ranch NeighborhoodEstimated Value: $789,271 - $1,011,000
--
Bed
3
Baths
1,971
Sq Ft
$475/Sq Ft
Est. Value
About This Home
This home is located at 7124 N Via de Alegria, Scottsdale, AZ 85258 and is currently estimated at $936,068, approximately $474 per square foot. 7124 N Via de Alegria is a home located in Maricopa County with nearby schools including Kiva Elementary School, Mohave Middle School, and Saguaro High School.
Ownership History
Date
Name
Owned For
Owner Type
Purchase Details
Closed on
Sep 28, 2020
Sold by
Repsold Peter B and Bailen Rosemary A
Bought by
Repsold Peter B and Bailen Rosemary A
Current Estimated Value
Home Financials for this Owner
Home Financials are based on the most recent Mortgage that was taken out on this home.
Original Mortgage
$106,400
Interest Rate
2.8%
Mortgage Type
New Conventional
Purchase Details
Closed on
Mar 28, 2019
Sold by
Repsold Peter B and Bailen Rosemary A
Bought by
Liv Repsold Peter B and Liv Peter B Repsold Revocable
Purchase Details
Closed on
May 1, 2001
Sold by
Repsold Peter B and Bailen Rosemary A
Bought by
Repsold Peter B
Create a Home Valuation Report for This Property
The Home Valuation Report is an in-depth analysis detailing your home's value as well as a comparison with similar homes in the area
Home Values in the Area
Average Home Value in this Area
Purchase History
| Date | Buyer | Sale Price | Title Company |
|---|---|---|---|
| Repsold Peter B | -- | None Available | |
| Repsold Peter B | -- | Unisource | |
| Liv Repsold Peter B | -- | Title Source Inc | |
| Repsold Peter B | -- | Title Source Inc | |
| Repsold Peter B | -- | -- | |
| Bailen Rosemary A | -- | -- |
Source: Public Records
Mortgage History
| Date | Status | Borrower | Loan Amount |
|---|---|---|---|
| Closed | Repsold Peter B | $106,400 |
Source: Public Records
Tax History Compared to Growth
Tax History
| Year | Tax Paid | Tax Assessment Tax Assessment Total Assessment is a certain percentage of the fair market value that is determined by local assessors to be the total taxable value of land and additions on the property. | Land | Improvement |
|---|---|---|---|---|
| 2025 | $2,438 | $40,675 | -- | -- |
| 2024 | $2,287 | $38,738 | -- | -- |
| 2023 | $2,287 | $58,270 | $11,650 | $46,620 |
| 2022 | $2,179 | $44,000 | $8,800 | $35,200 |
| 2021 | $2,363 | $40,200 | $8,040 | $32,160 |
| 2020 | $2,341 | $38,010 | $7,600 | $30,410 |
| 2019 | $2,275 | $35,480 | $7,090 | $28,390 |
| 2018 | $2,221 | $34,600 | $6,920 | $27,680 |
| 2017 | $2,097 | $34,070 | $6,810 | $27,260 |
| 2016 | $2,057 | $32,420 | $6,480 | $25,940 |
| 2015 | $1,976 | $28,730 | $5,740 | $22,990 |
Source: Public Records
Map
Nearby Homes
- 7039 N Vía de Amigos
- 8306 E Vía de Dorado
- 8347 E Vía de La Gente
- 8354 E Via de Dorado
- 7023 N Vía Nueva
- 8418 E Vía de Viva
- 8323 E Las Estancias St
- 7000 N Vía Camello Del Sur Unit 36
- 8338 E Joshua Tree Ln
- 8076 E Vía Del Arbor
- 7810 E Vía Camello Unit 72
- 8083 E Vía Del Valle
- 8324 E Cactus Wren Rd
- 7932 E Joshua Tree Ln
- 7507 N Vía de Los Libros
- 8082 E Vía Del Desierto
- 7428 N Via Camello Del Norte Unit 178
- 7817 E Via Del Futuro
- 7806 E Vía de La Entrada
- 8145 E Vía de Viva
- 7118 N Via de Alegria
- 7128 N Via de Alegria
- 7131 N Vía de Amigos
- 7131 N Via de Amigos
- 7125 N Via de Amigos
- 7132 N Vía de Alegria
- 7135 N Via de Amigos
- 7116 N Via de Alegria
- 7132 N Via de Alegria
- 7121 N Via de Amigos
- 7125 N Via de Alegria
- 7129 N Via de Alegria
- 7139 N Via de Amigos
- 7129 N Vía de Alegria
- 7117 N Via de Alegria
- 7136 N Via de Alegria
- 7112 N Via de Alegria
- 7115 N Via de Amigos
- 7133 N Via de Alegria
- 7143 N Via de Amigos