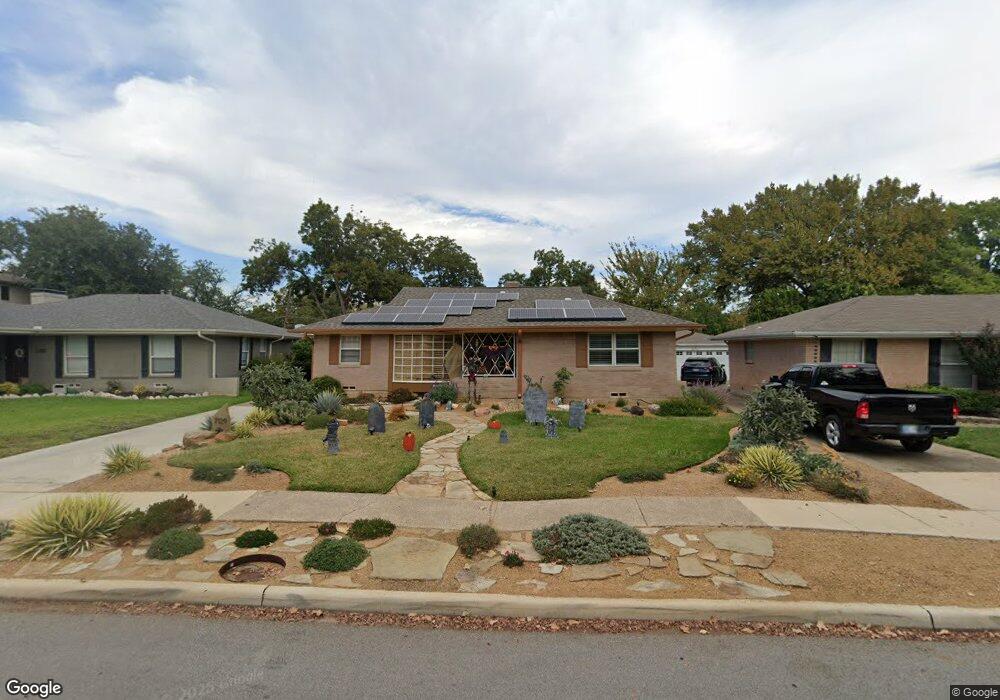
7129 Haverford Rd Dallas, TX 75214
Northeast Dallas NeighborhoodEstimated Value: $695,510 - $737,000
3
Beds
2
Baths
2,016
Sq Ft
$353/Sq Ft
Est. Value
About This Home
This home is located at 7129 Haverford Rd, Dallas, TX 75214 and is currently estimated at $711,878, approximately $353 per square foot. 7129 Haverford Rd is a home located in Dallas County with nearby schools including Lakewood Elementary School, J L Long Middle School, and Woodrow Wilson High School.
Ownership History
Date
Name
Owned For
Owner Type
Purchase Details
Closed on
Mar 7, 2008
Sold by
Brooke Family Living Trust
Bought by
Smith Jeffrey Glenn
Current Estimated Value
Purchase Details
Closed on
Dec 6, 2001
Sold by
Witt Geoffrey A and Witt Deanne L
Bought by
Smith Jeff G
Home Financials for this Owner
Home Financials are based on the most recent Mortgage that was taken out on this home.
Original Mortgage
$157,500
Interest Rate
6.52%
Purchase Details
Closed on
Jul 26, 1999
Sold by
Smith F Josephine and Smith Frances Josephine
Bought by
Witt Geoffrey A and Witt Deanne L
Home Financials for this Owner
Home Financials are based on the most recent Mortgage that was taken out on this home.
Original Mortgage
$132,500
Interest Rate
7.63%
Purchase Details
Closed on
Aug 21, 1997
Sold by
Smith Frances Josephine and Smith Laadan H
Bought by
Smith Josephine and Smith Family Trust
Create a Home Valuation Report for This Property
The Home Valuation Report is an in-depth analysis detailing your home's value as well as a comparison with similar homes in the area
Home Values in the Area
Average Home Value in this Area
Purchase History
| Date | Buyer | Sale Price | Title Company |
|---|---|---|---|
| Smith Jeffrey Glenn | -- | None Available | |
| Smith Jeff G | -- | Hexter Fair Title | |
| Witt Geoffrey A | -- | Chicago Title Insurance Co | |
| Smith Josephine | -- | -- |
Source: Public Records
Mortgage History
| Date | Status | Borrower | Loan Amount |
|---|---|---|---|
| Previous Owner | Smith Jeff G | $157,500 | |
| Previous Owner | Witt Geoffrey A | $132,500 |
Source: Public Records
Tax History Compared to Growth
Tax History
| Year | Tax Paid | Tax Assessment Tax Assessment Total Assessment is a certain percentage of the fair market value that is determined by local assessors to be the total taxable value of land and additions on the property. | Land | Improvement |
|---|---|---|---|---|
| 2025 | $8,740 | $686,200 | $400,000 | $286,200 |
| 2024 | $8,740 | $562,580 | $300,000 | $262,580 |
| 2023 | $8,740 | $511,970 | $300,000 | $211,970 |
| 2022 | $10,658 | $426,270 | $260,000 | $166,270 |
| 2021 | $11,245 | $426,270 | $260,000 | $166,270 |
| 2020 | $10,737 | $395,790 | $260,000 | $135,790 |
| 2019 | $11,261 | $395,790 | $260,000 | $135,790 |
| 2018 | $10,029 | $368,820 | $260,000 | $108,820 |
| 2017 | $8,623 | $317,120 | $240,000 | $77,120 |
| 2016 | $6,985 | $317,120 | $240,000 | $77,120 |
| 2015 | $6,247 | $295,000 | $185,000 | $110,000 |
| 2014 | $6,247 | $286,750 | $150,000 | $136,750 |
Source: Public Records
Map
Nearby Homes
- 7220 Haverford Rd
- 7126 Edgerton Dr
- 7325 Rutgers Dr
- 7318 Rockhurst Dr
- 7328 Rockhurst Dr
- 6742 E Northwest Hwy
- 7232 Syracuse Dr
- 7231 Syracuse Dr
- 6842 Arboreal Dr
- 7329 Dalewood Ln
- 6754 E Northwest Hwy
- 6772 E Northwest Hwy
- 6841 Arboreal Dr
- 6717 Pimlico Dr
- 6848 Town Dr N
- 6925 Galemeadow Cir
- 7456 E Northwest Hwy Unit 125
- 7462 E Northwest Hwy Unit 128
- 7496 E Northwest Hwy Unit 145
- 6912 Town Dr N
- 7135 Haverford Rd
- 7125 Haverford Rd
- 7119 Haverford Rd
- 7139 Haverford Rd
- 7118 Clemson Dr
- 7112 Clemson Dr
- 7124 Clemson Dr
- 7106 Clemson Dr
- 7128 Haverford Rd
- 7134 Haverford Rd
- 7115 Haverford Rd
- 7128 Clemson Dr
- 7145 Haverford Rd
- 7120 Haverford Rd
- 7138 Haverford Rd
- 7030 Clemson Dr
- 7134 Clemson Dr
- 7114 Haverford Rd
- 7109 Haverford Rd
- 7144 Haverford Rd