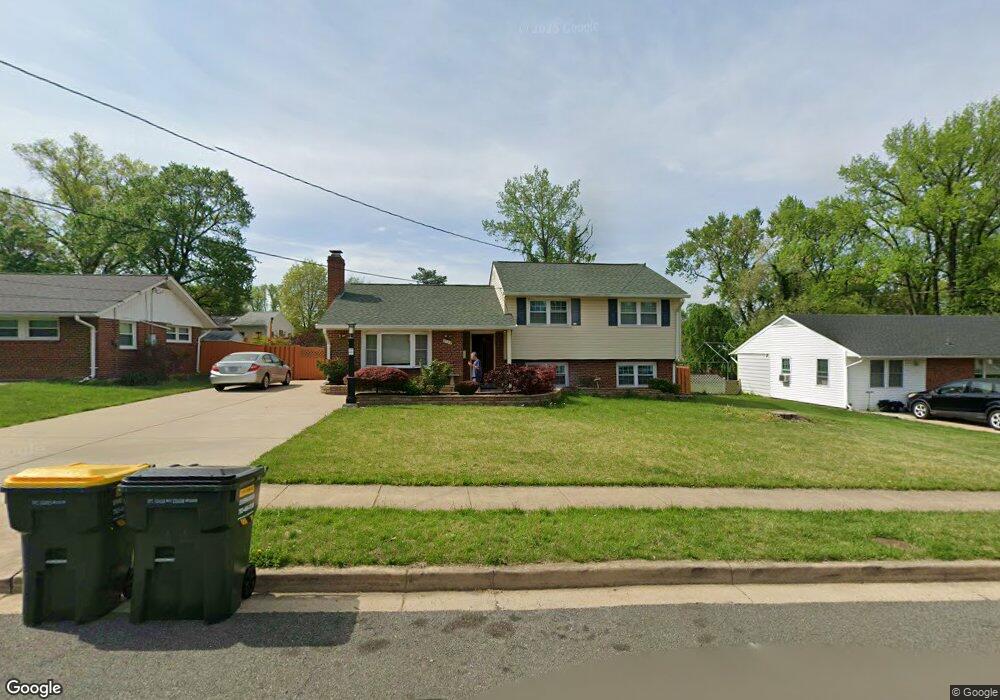
7129 Lanier St Annandale, VA 22003
Estimated Value: $583,000 - $684,000
4
Beds
2
Baths
1,270
Sq Ft
$506/Sq Ft
Est. Value
About This Home
This home is located at 7129 Lanier St, Annandale, VA 22003 and is currently estimated at $642,385, approximately $505 per square foot. 7129 Lanier St is a home located in Fairfax County with nearby schools including Annandale Terrace Elementary School, Poe Middle School, and Annandale High School.
Ownership History
Date
Name
Owned For
Owner Type
Purchase Details
Closed on
Oct 21, 2008
Sold by
Astoria Federal Savings &
Bought by
Pham Phuc Xuan and Trang,Tuyen Thi
Current Estimated Value
Home Financials for this Owner
Home Financials are based on the most recent Mortgage that was taken out on this home.
Original Mortgage
$292,500
Outstanding Balance
$190,732
Interest Rate
6.03%
Mortgage Type
New Conventional
Estimated Equity
$451,653
Purchase Details
Closed on
Jul 30, 2008
Sold by
Professional Foreclosure
Bought by
Astoria F S L
Purchase Details
Closed on
Aug 1, 2005
Sold by
Kim Bun Hea
Bought by
Kim Bun Hea and Kim,Hyun Kyung
Purchase Details
Closed on
Nov 17, 1994
Sold by
Flood Maurice S
Bought by
Kim Ki H
Home Financials for this Owner
Home Financials are based on the most recent Mortgage that was taken out on this home.
Original Mortgage
$134,400
Interest Rate
8.9%
Create a Home Valuation Report for This Property
The Home Valuation Report is an in-depth analysis detailing your home's value as well as a comparison with similar homes in the area
Home Values in the Area
Average Home Value in this Area
Purchase History
| Date | Buyer | Sale Price | Title Company |
|---|---|---|---|
| Pham Phuc Xuan | $360,000 | -- | |
| Astoria F S L | $381,500 | -- | |
| Kim Bun Hea | -- | -- | |
| Kim Ki H | $168,000 | -- |
Source: Public Records
Mortgage History
| Date | Status | Borrower | Loan Amount |
|---|---|---|---|
| Open | Pham Phuc Xuan | $292,500 | |
| Previous Owner | Kim Ki H | $134,400 |
Source: Public Records
Tax History
| Year | Tax Paid | Tax Assessment Tax Assessment Total Assessment is a certain percentage of the fair market value that is determined by local assessors to be the total taxable value of land and additions on the property. | Land | Improvement |
|---|---|---|---|---|
| 2025 | $6,607 | $600,470 | $250,000 | $350,470 |
| 2024 | $6,607 | $570,300 | $240,000 | $330,300 |
| 2023 | $6,373 | $564,710 | $240,000 | $324,710 |
| 2022 | $5,812 | $508,240 | $210,000 | $298,240 |
| 2021 | $5,620 | $478,910 | $195,000 | $283,910 |
| 2020 | $5,419 | $457,880 | $195,000 | $262,880 |
| 2019 | $5,071 | $428,510 | $184,000 | $244,510 |
| 2018 | $4,767 | $414,510 | $170,000 | $244,510 |
| 2017 | $4,812 | $414,510 | $170,000 | $244,510 |
| 2016 | $4,802 | $414,510 | $170,000 | $244,510 |
Source: Public Records
Map
Nearby Homes
- 7209 Sipes Ln
- 7052 Wardell St
- 4616 Exeter St
- 4700 Backlick Rd
- 7446 Fountain Head Dr
- 4313 Greenberry Ln
- 4055 Thornton Ct
- 7204 Quiet Cove
- 4765 Kandel Ct
- 7403 Carmine St
- 4599 Logsdon Dr Unit 37
- 4597 Logsdon Dr Unit 36
- 3908 Longstreet Ct
- 6725 Alpine Dr
- 7331 Calvert St
- 7313 Byrneley Ln
- 3906 Ridge Rd
- 4017 Woodland Rd
- 4201 Wynnwood Dr
- 3923 Forest Grove Dr
- 7131 Lanier St
- 7127 Lanier St
- 7128 Jayhawk St
- 7130 Jayhawk St
- 7133 Lanier St
- 7125 Lanier St
- 7126 Jayhawk St
- 7130 Lanier St
- 7132 Jayhawk St
- 7134 Lanier St
- 7124 Jayhawk St
- 7123 Lanier St
- 7132 Lanier St
- 7126 Lanier St
- 7135 Lanier St
- 4453 Backlick Rd
- 7128 Lanier St
- 7136 Lanier St
- 4455 Backlick Rd
- 7122 Jayhawk St
Your Personal Tour Guide
Ask me questions while you tour the home.