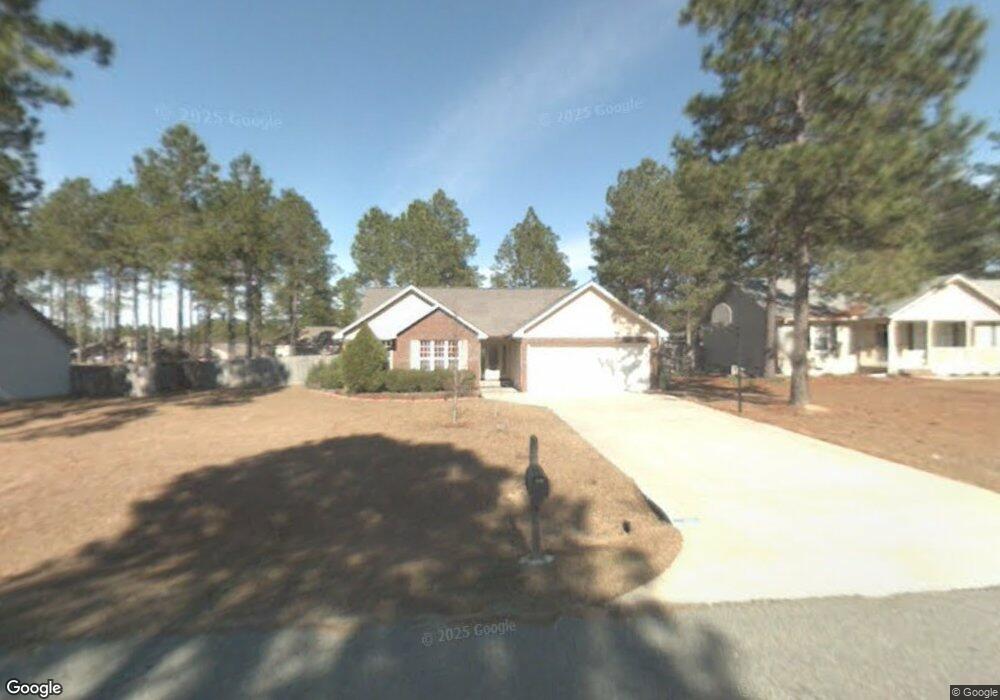
713 44th St E Tifton, GA 31794
Estimated Value: $268,000 - $287,000
3
Beds
2
Baths
1,673
Sq Ft
$166/Sq Ft
Est. Value
About This Home
This home is located at 713 44th St E, Tifton, GA 31794 and is currently estimated at $277,268, approximately $165 per square foot. 713 44th St E is a home located in Tift County with nearby schools including Northside Primary School, Charles Spencer Elementary School, and J.T. Reddick School.
Ownership History
Date
Name
Owned For
Owner Type
Purchase Details
Closed on
Aug 28, 2020
Sold by
Lee Michael S
Bought by
Dean John Morgan and Dean Kelci
Current Estimated Value
Home Financials for this Owner
Home Financials are based on the most recent Mortgage that was taken out on this home.
Original Mortgage
$173,630
Outstanding Balance
$152,325
Interest Rate
2.9%
Mortgage Type
New Conventional
Estimated Equity
$124,943
Purchase Details
Closed on
May 25, 2004
Sold by
Sirva Relocation Llc
Bought by
Lee Michael S and Lee Leann
Purchase Details
Closed on
Dec 8, 2000
Sold by
Collins Eugene
Bought by
Rae Mary L
Purchase Details
Closed on
Mar 28, 1996
Sold by
Collins Eugene
Bought by
Collins Eugene and Collins Carolyn
Purchase Details
Closed on
Mar 27, 1996
Sold by
Chandler Construction Corp
Bought by
Collins Eugene
Create a Home Valuation Report for This Property
The Home Valuation Report is an in-depth analysis detailing your home's value as well as a comparison with similar homes in the area
Purchase History
| Date | Buyer | Sale Price | Title Company |
|---|---|---|---|
| Dean John Morgan | $179,000 | -- | |
| Lee Michael S | $136,000 | -- | |
| Sirva Relocation Llc | -- | -- | |
| Rae Mary L | $111,000 | -- | |
| Collins Eugene | -- | -- | |
| Collins Eugene | $98,400 | -- |
Source: Public Records
Mortgage History
| Date | Status | Borrower | Loan Amount |
|---|---|---|---|
| Open | Dean John Morgan | $173,630 |
Source: Public Records
Tax History
| Year | Tax Paid | Tax Assessment Tax Assessment Total Assessment is a certain percentage of the fair market value that is determined by local assessors to be the total taxable value of land and additions on the property. | Land | Improvement |
|---|---|---|---|---|
| 2025 | $2,757 | $94,058 | $10,000 | $84,058 |
| 2024 | $2,757 | $102,234 | $10,000 | $92,234 |
| 2023 | $2,491 | $63,591 | $8,000 | $55,591 |
| 2022 | $2,393 | $63,591 | $8,000 | $55,591 |
| 2021 | $2,409 | $63,591 | $8,000 | $55,591 |
| 2020 | $2,103 | $54,176 | $8,000 | $46,176 |
| 2019 | $2,104 | $54,176 | $8,000 | $46,176 |
| 2018 | $2,105 | $54,176 | $8,000 | $46,176 |
| 2017 | $2,184 | $54,797 | $8,000 | $46,797 |
| 2016 | $2,187 | $54,797 | $8,000 | $46,797 |
| 2015 | $2,189 | $54,797 | $8,000 | $46,797 |
| 2014 | $2,192 | $54,797 | $8,000 | $46,797 |
| 2013 | -- | $54,797 | $8,000 | $46,797 |
Source: Public Records
Map
Nearby Homes
- 603 48th St
- 346 Somers Ln
- 603 40th St E
- 909 E 46th St
- 2612 Goff St
- 2417 Belmont Ave
- 0 Belflower Rd Unit 25624433
- 0 Belflower Rd Unit 139026
- 0 Belflower Rd Unit 24022932
- 0 Belflower Rd Unit 138547
- 0 Belflower Rd Unit 10554704
- 2209 Meadowbrook Dr
- 2014 Davis Ave
- 2214 Love Ave
- 2014 Tyson Ave
- 303 26th St W
- 2605 Murray Ave
- 502 20th St E
- -0- Old Ocilla Rd
- 1809 Davis Ave
Your Personal Tour Guide
Ask me questions while you tour the home.