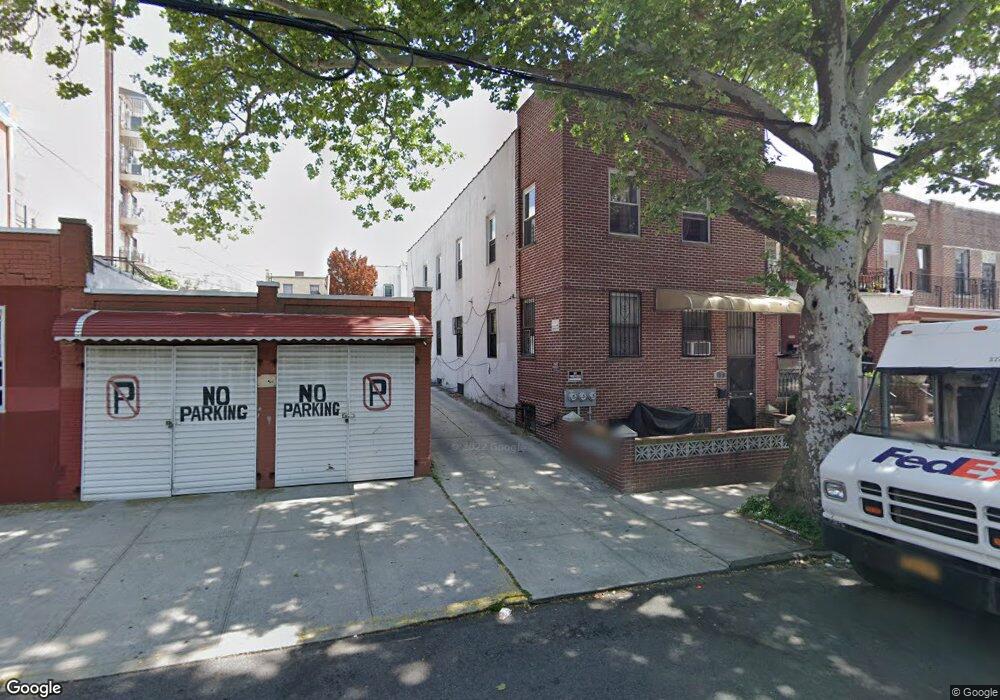
713 47th St Brooklyn, NY 11220
Sunset Park NeighborhoodEstimated Value: $1,619,000 - $1,818,000
--
Bed
--
Bath
2,530
Sq Ft
$679/Sq Ft
Est. Value
About This Home
This home is located at 713 47th St, Brooklyn, NY 11220 and is currently estimated at $1,718,574, approximately $679 per square foot. 713 47th St is a home located in Kings County with nearby schools including P.S. 169 Sunset Park, I.S. 223 The Montauk, and Kehilath Yakov Pupa.
Ownership History
Date
Name
Owned For
Owner Type
Purchase Details
Closed on
Jan 19, 2018
Sold by
Dong Qing and Jiang Jing Xue
Bought by
Dong Qing
Current Estimated Value
Purchase Details
Closed on
Sep 6, 2012
Sold by
Lin Zhou Yun and Zheng Xiu Gan
Bought by
Dong Qing and Jiang Jing Xue
Purchase Details
Closed on
Feb 26, 2009
Sold by
Catherine Cetta As Trustee and Cetta
Bought by
Cetta Catherine and Cetta Michael
Home Financials for this Owner
Home Financials are based on the most recent Mortgage that was taken out on this home.
Original Mortgage
$533,000
Interest Rate
5.14%
Mortgage Type
Purchase Money Mortgage
Purchase Details
Closed on
Aug 28, 2002
Sold by
Cetta Catherine and Cetta Michael
Bought by
Cetta Kathryn
Create a Home Valuation Report for This Property
The Home Valuation Report is an in-depth analysis detailing your home's value as well as a comparison with similar homes in the area
Home Values in the Area
Average Home Value in this Area
Purchase History
| Date | Buyer | Sale Price | Title Company |
|---|---|---|---|
| Dong Qing | -- | -- | |
| Dong Qing | -- | -- | |
| Dong Qing | $900,000 | -- | |
| Dong Qing | $900,000 | -- | |
| Cetta Catherine | -- | -- | |
| Cetta Catherine | -- | -- | |
| Cetta Catherine | -- | -- | |
| Lin Zhou Yun | $850,000 | -- | |
| Lin Zhou Yun | $850,000 | -- | |
| Cetta Kathryn | -- | -- | |
| Cetta Kathryn | -- | -- |
Source: Public Records
Mortgage History
| Date | Status | Borrower | Loan Amount |
|---|---|---|---|
| Previous Owner | Cetta Catherine | $533,000 |
Source: Public Records
Tax History Compared to Growth
Tax History
| Year | Tax Paid | Tax Assessment Tax Assessment Total Assessment is a certain percentage of the fair market value that is determined by local assessors to be the total taxable value of land and additions on the property. | Land | Improvement |
|---|---|---|---|---|
| 2025 | $11,057 | $91,500 | $25,620 | $65,880 |
| 2024 | $11,057 | $92,700 | $25,620 | $67,080 |
| 2023 | $11,045 | $103,020 | $25,620 | $77,400 |
| 2022 | $9,776 | $94,980 | $25,620 | $69,360 |
| 2021 | $10,848 | $87,060 | $25,620 | $61,440 |
| 2020 | $5,087 | $105,540 | $25,620 | $79,920 |
| 2019 | $9,597 | $106,560 | $25,620 | $80,940 |
| 2018 | $9,239 | $45,322 | $9,894 | $35,428 |
| 2017 | $8,791 | $43,124 | $12,621 | $30,503 |
| 2016 | $8,587 | $42,955 | $15,034 | $27,921 |
| 2015 | $4,687 | $40,524 | $17,913 | $22,611 |
| 2014 | $4,687 | $38,231 | $17,050 | $21,181 |
Source: Public Records
Map
Nearby Homes