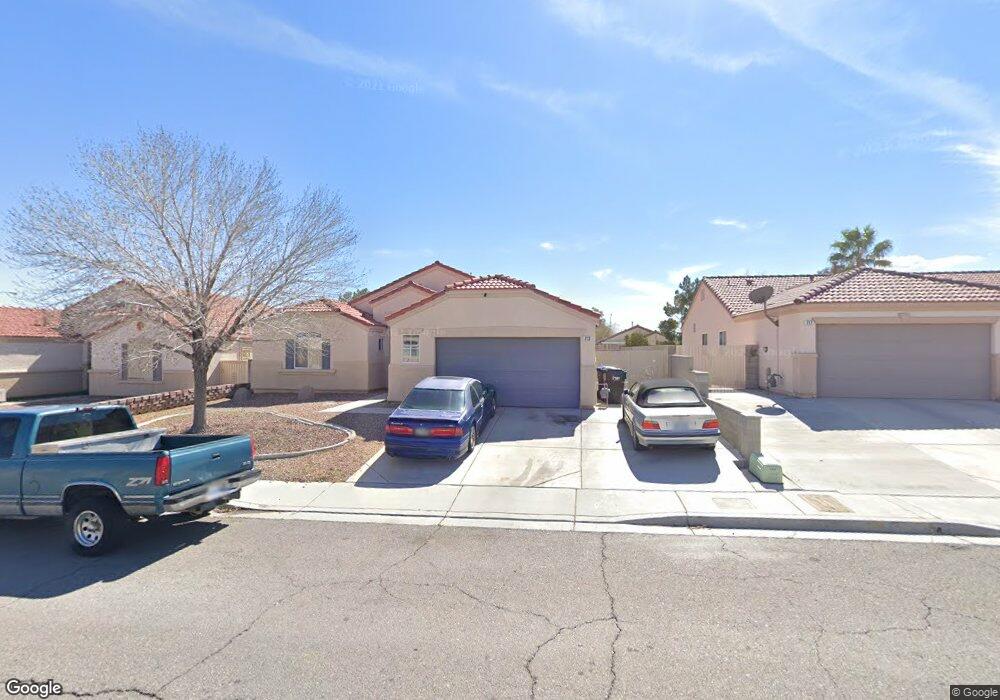
713 Azure Banks Ave Unit 1 North Las Vegas, NV 89031
Craig Ranch NeighborhoodEstimated Value: $411,956 - $424,000
4
Beds
2
Baths
1,797
Sq Ft
$233/Sq Ft
Est. Value
About This Home
This home is located at 713 Azure Banks Ave Unit 1, North Las Vegas, NV 89031 and is currently estimated at $418,739, approximately $233 per square foot. 713 Azure Banks Ave Unit 1 is a home located in Clark County with nearby schools including Fredric W. Watson Elementary School, Clifford O. Findlay Middle School, and Legacy High School.
Ownership History
Date
Name
Owned For
Owner Type
Purchase Details
Closed on
Nov 30, 2001
Sold by
Backus Lisa
Bought by
Backus Marcel A
Current Estimated Value
Home Financials for this Owner
Home Financials are based on the most recent Mortgage that was taken out on this home.
Original Mortgage
$148,494
Outstanding Balance
$58,283
Interest Rate
6.63%
Mortgage Type
FHA
Estimated Equity
$360,456
Purchase Details
Closed on
Nov 29, 2001
Sold by
Backus Marcel A
Bought by
Bailey Marshall L
Home Financials for this Owner
Home Financials are based on the most recent Mortgage that was taken out on this home.
Original Mortgage
$148,494
Outstanding Balance
$58,283
Interest Rate
6.63%
Mortgage Type
FHA
Estimated Equity
$360,456
Purchase Details
Closed on
May 20, 1999
Sold by
Azure Estates Llc
Bought by
Backus Marcel A
Home Financials for this Owner
Home Financials are based on the most recent Mortgage that was taken out on this home.
Original Mortgage
$125,559
Interest Rate
6.86%
Mortgage Type
FHA
Create a Home Valuation Report for This Property
The Home Valuation Report is an in-depth analysis detailing your home's value as well as a comparison with similar homes in the area
Home Values in the Area
Average Home Value in this Area
Purchase History
| Date | Buyer | Sale Price | Title Company |
|---|---|---|---|
| Backus Marcel A | -- | Lawyers Title | |
| Bailey Marshall L | $151,000 | Lawyers Title | |
| Backus Marcel A | $127,500 | United Title |
Source: Public Records
Mortgage History
| Date | Status | Borrower | Loan Amount |
|---|---|---|---|
| Open | Bailey Marshall L | $148,494 | |
| Previous Owner | Backus Marcel A | $125,559 |
Source: Public Records
Tax History Compared to Growth
Tax History
| Year | Tax Paid | Tax Assessment Tax Assessment Total Assessment is a certain percentage of the fair market value that is determined by local assessors to be the total taxable value of land and additions on the property. | Land | Improvement |
|---|---|---|---|---|
| 2025 | $1,857 | $98,855 | $30,100 | $68,755 |
| 2024 | $1,720 | $98,855 | $30,100 | $68,755 |
| 2023 | $1,720 | $95,865 | $30,800 | $65,065 |
| 2022 | $1,593 | $82,946 | $23,450 | $59,496 |
| 2021 | $1,475 | $78,758 | $22,050 | $56,708 |
| 2020 | $1,367 | $78,018 | $21,700 | $56,318 |
| 2019 | $1,281 | $73,739 | $18,200 | $55,539 |
| 2018 | $1,223 | $67,364 | $14,000 | $53,364 |
| 2017 | $2,098 | $62,540 | $12,250 | $50,290 |
| 2016 | $1,145 | $50,483 | $7,700 | $42,783 |
| 2015 | $1,142 | $39,439 | $7,350 | $32,089 |
| 2014 | $1,109 | $34,138 | $5,600 | $28,538 |
Source: Public Records
Map
Nearby Homes
- 629 Blossom Berry Ct
- 635 Dry Valley Ave
- 623 Dry Valley Ave
- 901 Sage Hollow Cir
- 6001 Kitamaya St
- 825 Cornerstone Place
- 5829 Forest Creek Rd
- 6119 Magic Mesa St
- 717 W Azure Ave Unit 3
- 721 W Azure Ave
- 1003 Dover Glen Dr
- 5912 Hollowridge Rd
- 5808 Lone Song Rd
- 628 Bright Lights Ave
- 625 Bright Lights Ave
- 1009 Nawkee Dr
- 351 Caneflower Ct
- 6136 Benchmark Way
- 5741 Copper Sun Ct
- 5717 Wizard Wand St
- 709 Azure Banks Ave
- 717 Azure Banks Ave
- 705 Azure Banks Ave
- 721 Azure Banks Ave
- 714 Azure Banks Ave Unit 1
- 710 Azure Banks Ave
- 718 Azure Banks Ave
- 725 Azure Banks Ave
- 710 Rio Royal Way
- 706 Azure Banks Ave
- 722 Azure Banks Ave
- 714 Rio Royal Way
- 706 Rio Royal Way
- 718 Rio Royal Way
- 637 Azure Banks Ave
- 726 Azure Banks Ave
- 729 Azure Banks Ave
- 722 Rio Royal Way
- 713 Brittany Falls Ct
- 709 Brittany Falls Ct