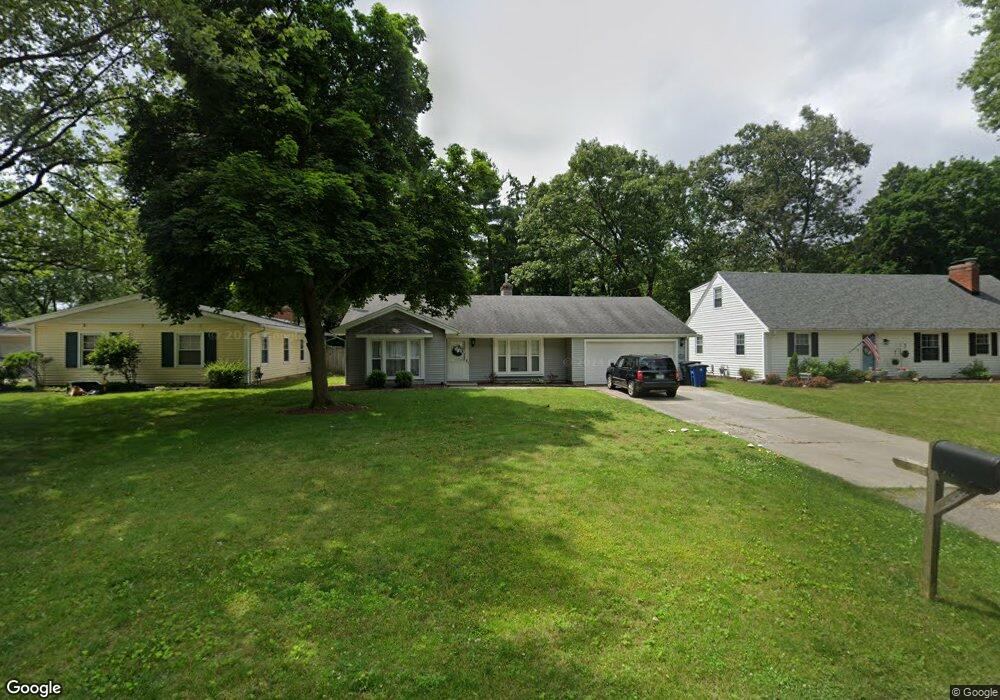
713 Birch St Bowling Green, OH 43402
Estimated Value: $228,000 - $279,000
3
Beds
2
Baths
1,476
Sq Ft
$173/Sq Ft
Est. Value
About This Home
This home is located at 713 Birch St, Bowling Green, OH 43402 and is currently estimated at $255,180, approximately $172 per square foot. 713 Birch St is a home located in Wood County with nearby schools including Bowling Green High School, Montessori School Of Bowling Green, and Bowling Green Christian Academy.
Ownership History
Date
Name
Owned For
Owner Type
Purchase Details
Closed on
Dec 18, 2012
Sold by
Djv V Company
Bought by
Vorhis Daniel J Van
Current Estimated Value
Purchase Details
Closed on
Dec 14, 2009
Sold by
Black Swamp Investment Properties Ltd
Bought by
Djv V Company and Vanvorhis D June
Purchase Details
Closed on
May 29, 2009
Sold by
Vanvorhis Daniel J and Vanvorhis Dan
Bought by
Black Swamp Investment Properties Ltd
Purchase Details
Closed on
Jun 1, 2006
Sold by
Johnson Jeffrey D
Bought by
Vanvorhis Daniel
Home Financials for this Owner
Home Financials are based on the most recent Mortgage that was taken out on this home.
Original Mortgage
$116,100
Interest Rate
10.75%
Mortgage Type
Purchase Money Mortgage
Purchase Details
Closed on
Jan 29, 1990
Bought by
Johnson Jeffrey D
Create a Home Valuation Report for This Property
The Home Valuation Report is an in-depth analysis detailing your home's value as well as a comparison with similar homes in the area
Home Values in the Area
Average Home Value in this Area
Purchase History
| Date | Buyer | Sale Price | Title Company |
|---|---|---|---|
| Vorhis Daniel J Van | -- | None Available | |
| Djv V Company | $115,500 | American Title Agency | |
| Black Swamp Investment Properties Ltd | -- | American Title Agency | |
| Vanvorhis Daniel | $129,000 | -- | |
| Johnson Jeffrey D | $97,000 | -- |
Source: Public Records
Mortgage History
| Date | Status | Borrower | Loan Amount |
|---|---|---|---|
| Previous Owner | Vanvorhis Daniel | $116,100 |
Source: Public Records
Tax History Compared to Growth
Tax History
| Year | Tax Paid | Tax Assessment Tax Assessment Total Assessment is a certain percentage of the fair market value that is determined by local assessors to be the total taxable value of land and additions on the property. | Land | Improvement |
|---|---|---|---|---|
| 2024 | $2,922 | $66,290 | $10,395 | $55,895 |
| 2023 | $2,922 | $66,300 | $10,400 | $55,900 |
| 2021 | $2,397 | $54,010 | $9,700 | $44,310 |
| 2020 | $2,403 | $54,010 | $9,700 | $44,310 |
| 2019 | $2,221 | $47,570 | $9,700 | $37,870 |
| 2018 | $2,209 | $47,570 | $9,700 | $37,870 |
| 2017 | $2,185 | $47,570 | $9,700 | $37,870 |
| 2016 | $1,891 | $40,710 | $9,700 | $31,010 |
| 2015 | $1,891 | $40,710 | $9,700 | $31,010 |
| 2014 | $1,950 | $40,710 | $9,700 | $31,010 |
| 2013 | $2,142 | $41,550 | $9,700 | $31,850 |
Source: Public Records
Map
Nearby Homes
- 519 Knollwood Dr
- 1024 Clark St
- 14732 Sand Ridge Rd
- 14580 Sand Ridge Rd
- 518 S Grove St
- 448 S Church St
- 4 Mackenzie Ct
- 7 Augusta Dr Unit 7
- 1025 Indian Ridge Dr
- 8 Arlington Ct
- 893 W Wooster St
- 535 W Gypsy Lane Rd
- 1321 Charles St
- 0 Haskins Rd Unit 6132516
- Lot 36 S Prospect St
- Lot 41 S Prospect St
- Lot 40 S Prospect St
- 608 S Summit St
- 545 Wallace Ave
- 210 W Wooster St