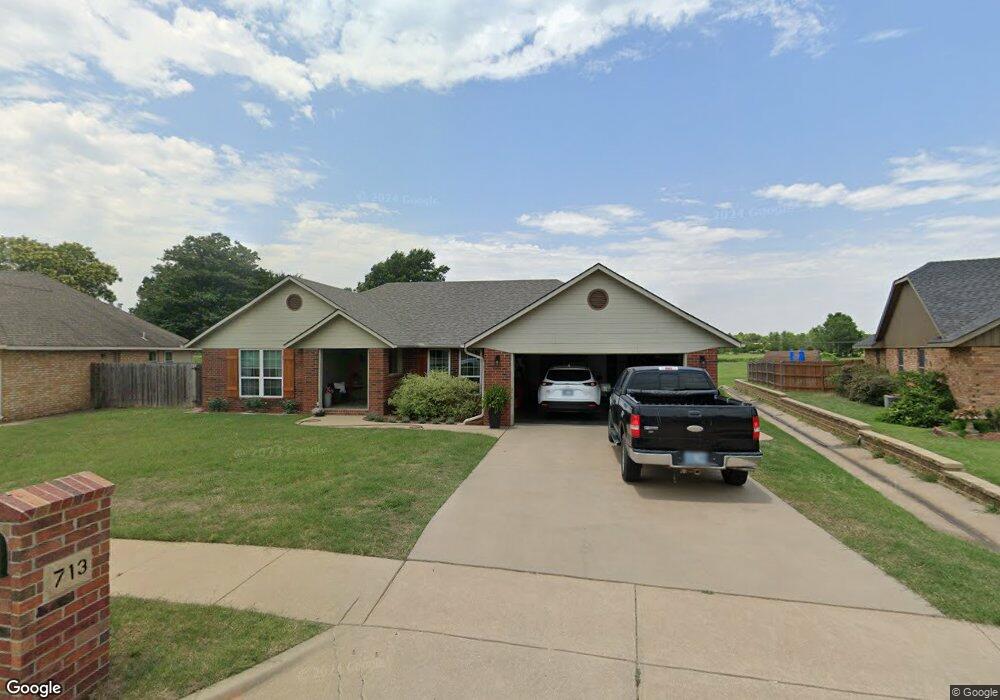
713 Brentwood Dr Ponca City, OK 74601
Estimated Value: $207,000 - $232,000
3
Beds
2
Baths
1,863
Sq Ft
$116/Sq Ft
Est. Value
About This Home
This home is located at 713 Brentwood Dr, Ponca City, OK 74601 and is currently estimated at $216,092, approximately $115 per square foot. 713 Brentwood Dr is a home located in Kay County with nearby schools including Union Elementary School, Ponca City East Middle School, and Ponca City West Middle School.
Ownership History
Date
Name
Owned For
Owner Type
Purchase Details
Closed on
Nov 2, 2018
Sold by
Briley Kell
Bought by
Crain Christopher
Current Estimated Value
Home Financials for this Owner
Home Financials are based on the most recent Mortgage that was taken out on this home.
Original Mortgage
$142,500
Outstanding Balance
$124,785
Interest Rate
4.6%
Mortgage Type
New Conventional
Estimated Equity
$91,307
Purchase Details
Closed on
Jan 17, 2013
Sold by
Ramsey Linda K
Bought by
Briley Kelli
Home Financials for this Owner
Home Financials are based on the most recent Mortgage that was taken out on this home.
Original Mortgage
$97,600
Interest Rate
3.34%
Mortgage Type
New Conventional
Purchase Details
Closed on
Mar 24, 2003
Sold by
Gmac Global Relocation
Bought by
Linda Roy and Linda Ramsey
Purchase Details
Closed on
Jul 6, 2000
Sold by
Aaron Gard and Anita Hager
Bought by
Anita Aaron and Anita Gard
Purchase Details
Closed on
Jun 10, 1996
Sold by
Mary Blaine and Mary Talbot
Bought by
Aaron Gard and Anita Hager
Create a Home Valuation Report for This Property
The Home Valuation Report is an in-depth analysis detailing your home's value as well as a comparison with similar homes in the area
Home Values in the Area
Average Home Value in this Area
Purchase History
| Date | Buyer | Sale Price | Title Company |
|---|---|---|---|
| Crain Christopher | $150,000 | Stewart Escrow & Title | |
| Briley Kelli | $122,000 | None Available | |
| Linda Roy | $130,000 | -- | |
| Gmac Global Relocation | $130,000 | -- | |
| Anita Aaron | -- | -- | |
| Aaron Gard | $96,000 | -- |
Source: Public Records
Mortgage History
| Date | Status | Borrower | Loan Amount |
|---|---|---|---|
| Open | Crain Christopher | $142,500 | |
| Previous Owner | Briley Kelli | $97,600 |
Source: Public Records
Tax History Compared to Growth
Tax History
| Year | Tax Paid | Tax Assessment Tax Assessment Total Assessment is a certain percentage of the fair market value that is determined by local assessors to be the total taxable value of land and additions on the property. | Land | Improvement |
|---|---|---|---|---|
| 2024 | $1,619 | $18,097 | $1,729 | $16,368 |
| 2023 | $1,619 | $17,570 | $1,729 | $15,841 |
| 2022 | $1,528 | $17,058 | $1,729 | $15,329 |
| 2021 | $1,536 | $17,058 | $1,729 | $15,329 |
| 2020 | $1,615 | $17,058 | $1,729 | $15,329 |
| 2019 | $1,576 | $16,500 | $1,729 | $14,771 |
| 2018 | $1,163 | $13,013 | $1,729 | $11,284 |
| 2017 | $1,210 | $13,343 | $1,729 | $11,614 |
| 2016 | $1,255 | $13,674 | $1,729 | $11,945 |
| 2015 | $1,239 | $13,454 | $1,729 | $11,725 |
| 2014 | $1,212 | $13,421 | $1,729 | $11,692 |
Source: Public Records
Map
Nearby Homes
- TBD 5th and Windsor
- 1009 Brentwood Dr
- 2000 N 5th St
- 2005 N 4th St
- 120 E Woodbury Rd
- 0000 N Union St
- 3651 N 14th St
- 1412 Donahoe Dr
- 1128 N 14th St
- 304 E Detroit Ave
- 3019 Meadow Ln
- 1600 Monument Rd
- 734 E Albany Ave
- 1704 Fairway Place
- 3013 Kingston Rd
- 1013 N 7th St
- 1703 Leslie Ln
- 2023 Turner St
- 2223 Turner St
- 1708 Potomac Dr
- 717 Brentwood Dr
- 709 Brentwood Dr
- 801 Brentwood Dr
- 708 Brentwood Dr
- 805 Brentwood Dr
- 701 Brentwood Dr
- 2312 Calvert Dr
- 809 Brentwood Dr
- 704 Brentwood Dr
- 2308 Calvert Dr
- 700 Brentwood Dr
- 813 Brentwood Dr
- 2304 Calvert Dr
- 2317 Calvert Dr
- 901 Brentwood Dr
- 2300 Calvert Dr
- 2313 Calvert Dr
- 2608 Windsor Rd
- 2236 Jane St
- 905 Brentwood Dr