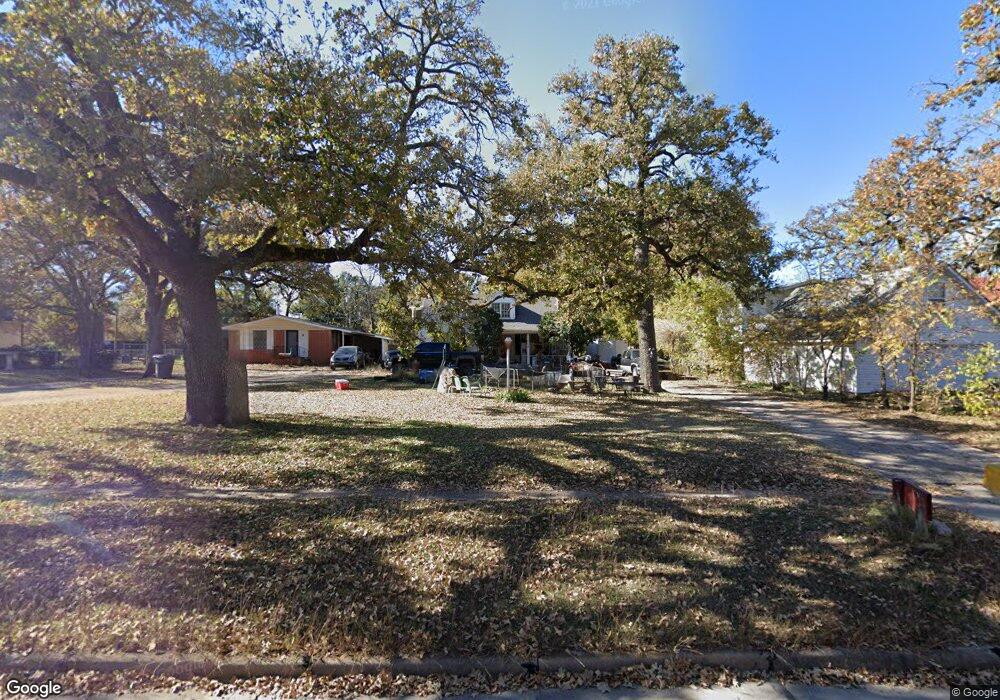
713 C St SE Ardmore, OK 73401
Estimated Value: $133,000 - $156,000
3
Beds
2
Baths
1,602
Sq Ft
$88/Sq Ft
Est. Value
About This Home
This home is located at 713 C St SE, Ardmore, OK 73401 and is currently estimated at $140,503, approximately $87 per square foot. 713 C St SE is a home located in Carter County with nearby schools including Jefferson Elementary School, Ardmore Middle School, and Ardmore High School.
Ownership History
Date
Name
Owned For
Owner Type
Purchase Details
Closed on
Feb 22, 2013
Sold by
Dollar Debra and Dollar Thomas
Bought by
Jones Ronald and Jones Cheryl
Current Estimated Value
Home Financials for this Owner
Home Financials are based on the most recent Mortgage that was taken out on this home.
Original Mortgage
$60,877
Outstanding Balance
$42,240
Interest Rate
3.25%
Mortgage Type
FHA
Estimated Equity
$98,263
Purchase Details
Closed on
Feb 21, 1995
Sold by
Howell Dan
Bought by
Howell Debra
Create a Home Valuation Report for This Property
The Home Valuation Report is an in-depth analysis detailing your home's value as well as a comparison with similar homes in the area
Home Values in the Area
Average Home Value in this Area
Purchase History
| Date | Buyer | Sale Price | Title Company |
|---|---|---|---|
| Jones Ronald | $62,000 | None Available | |
| Howell Debra | -- | -- |
Source: Public Records
Mortgage History
| Date | Status | Borrower | Loan Amount |
|---|---|---|---|
| Open | Jones Ronald | $60,877 |
Source: Public Records
Tax History Compared to Growth
Tax History
| Year | Tax Paid | Tax Assessment Tax Assessment Total Assessment is a certain percentage of the fair market value that is determined by local assessors to be the total taxable value of land and additions on the property. | Land | Improvement |
|---|---|---|---|---|
| 2024 | $914 | $9,255 | $900 | $8,355 |
| 2023 | $870 | $8,814 | $900 | $7,914 |
| 2022 | $803 | $8,395 | $900 | $7,495 |
| 2021 | $807 | $7,995 | $900 | $7,095 |
| 2020 | $757 | $7,614 | $1,200 | $6,414 |
| 2019 | $704 | $7,252 | $1,200 | $6,052 |
| 2018 | $682 | $6,907 | $1,200 | $5,707 |
| 2017 | $601 | $6,578 | $1,200 | $5,378 |
| 2016 | $584 | $6,264 | $1,200 | $5,064 |
| 2015 | $508 | $6,610 | $1,200 | $5,410 |
| 2014 | $572 | $7,440 | $417 | $7,023 |
Source: Public Records
Map
Nearby Homes