Estimated Value: $188,736 - $222,000
3
Beds
2
Baths
1,366
Sq Ft
$146/Sq Ft
Est. Value
About This Home
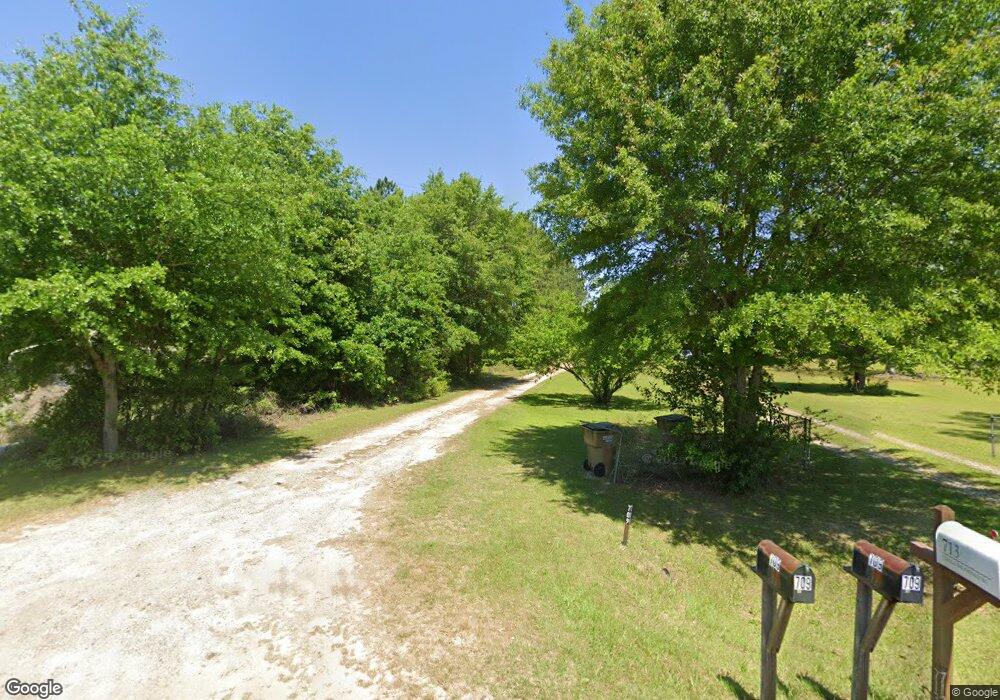
This home is located at 713 Chula Brookfield Rd, Chula, GA 31733 and is currently estimated at $199,912, approximately $146 per square foot. 713 Chula Brookfield Rd is a home located in Tift County with nearby schools including Len Lastinger Primary School, Matt Wilson Elementary School, and J.T. Reddick School.
Ownership History
Date
Name
Owned For
Owner Type
Purchase Details
Closed on
Apr 15, 2019
Sold by
Ellis Kanda
Bought by
Hughes Steven Loran
Current Estimated Value
Home Financials for this Owner
Home Financials are based on the most recent Mortgage that was taken out on this home.
Original Mortgage
$88,271
Outstanding Balance
$77,330
Interest Rate
4.62%
Mortgage Type
FHA
Estimated Equity
$122,582
Purchase Details
Closed on
Oct 2, 2007
Sold by
Patrick Robert
Bought by
Smith Kanda
Home Financials for this Owner
Home Financials are based on the most recent Mortgage that was taken out on this home.
Original Mortgage
$84,150
Interest Rate
6.44%
Mortgage Type
New Conventional
Purchase Details
Closed on
Oct 18, 2001
Sold by
Chase Manhattan Bank
Bought by
Patrick Brandt
Purchase Details
Closed on
May 1, 2001
Sold by
Baldree Misty S
Bought by
Chase Manhattan Bank
Purchase Details
Closed on
Feb 24, 1998
Bought by
Baldree Misty S
Create a Home Valuation Report for This Property
The Home Valuation Report is an in-depth analysis detailing your home's value as well as a comparison with similar homes in the area
Purchase History
| Date | Buyer | Sale Price | Title Company |
|---|---|---|---|
| Hughes Steven Loran | $89,900 | -- | |
| Smith Kanda | $82,500 | -- | |
| Patrick Brandt | $42,000 | -- | |
| Chase Manhattan Bank | $55,000 | -- | |
| Baldree Misty S | -- | -- |
Source: Public Records
Mortgage History
| Date | Status | Borrower | Loan Amount |
|---|---|---|---|
| Open | Hughes Steven Loran | $88,271 | |
| Previous Owner | Smith Kanda | $84,150 |
Source: Public Records
Tax History
| Year | Tax Paid | Tax Assessment Tax Assessment Total Assessment is a certain percentage of the fair market value that is determined by local assessors to be the total taxable value of land and additions on the property. | Land | Improvement |
|---|---|---|---|---|
| 2025 | $1,158 | $53,061 | $2,112 | $50,949 |
| 2024 | $1,158 | $53,061 | $2,112 | $50,949 |
| 2023 | $1,258 | $35,080 | $3,000 | $32,080 |
| 2022 | $1,041 | $35,080 | $3,000 | $32,080 |
| 2021 | $1,047 | $35,080 | $3,000 | $32,080 |
| 2020 | $1,067 | $35,080 | $3,000 | $32,080 |
| 2019 | $1,004 | $35,080 | $3,000 | $32,080 |
| 2018 | $1,003 | $35,080 | $3,000 | $32,080 |
| 2017 | $1,008 | $35,080 | $3,000 | $32,080 |
| 2016 | $1,009 | $35,080 | $3,000 | $32,080 |
| 2015 | $1,009 | $35,080 | $3,000 | $32,080 |
| 2014 | $1,011 | $35,080 | $3,000 | $32,080 |
| 2013 | -- | $35,080 | $3,000 | $32,080 |
Source: Public Records
Map
Nearby Homes
- 18 Hank Mike Rd
- 746 Chula Brookfield Rd
- 50 Hank Mike Rd
- 257 Adams Rd
- 277 Wesley Rigdon Rd
- n/a Wiley Branch Rd
- 87 Waterfront St
- 100 Long Pine Rd
- 897 Wiley Branch Rd
- 0 Brighton Rd
- 136 S Access Rd
- 901 Wiley Branch Rd
- 142 Brighton Rd
- 50 Margaret Ln
- 68 Rose Ave
- 5704 Forest Lake Dr W
- Lot 222 Forest Lakes Dr
- 603 48th St
- 0 Forest Lake Dr W Unit 134325
- 346 Somers Ln
- 709 Chula Brookfield Rd
- 721 Chula Brookfield Rd
- 715 Chula Brookfield Rd
- 5136 Ga Highway 125 N
- 5146 Ga Highway 125 N
- 711 Chula Brookfield Rd
- 10 Hank Mike Rd
- 736 Chula Brookfield Rd
- 701 Chula Brookfield Rd
- 693 Chula Brookfield Rd
- 750 Chula Brookfield Rd
- 685 Chula Brookfield Rd
- 748 Chula Brookfield Rd
- 696 Chula Brookfield Rd
- 5106 Ga Highway 125 N
- 777 Chula Brookfield Rd
- 688 Chula Brookfield Rd
- 675 Chula Brookfield Rd
- 29 Hank Mike Rd
- 680 Chula Brookfield Rd
Your Personal Tour Guide
Ask me questions while you tour the home.