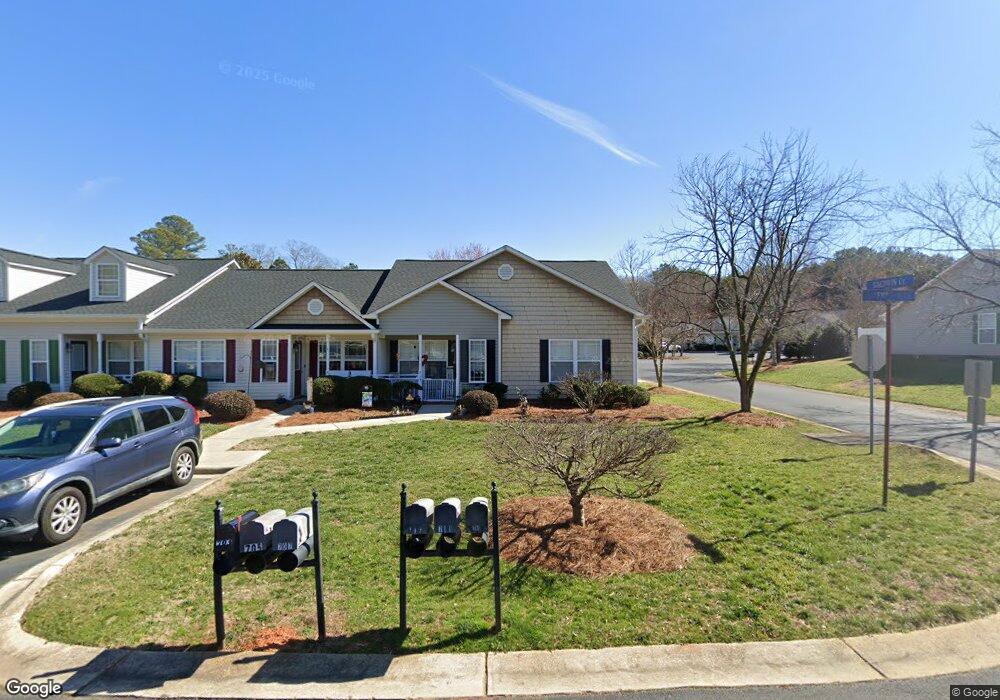
713 Dalebrook Ln Unit 78 Rock Hill, SC 29730
Estimated Value: $227,000 - $251,000
3
Beds
2
Baths
1,085
Sq Ft
$219/Sq Ft
Est. Value
About This Home
This home is located at 713 Dalebrook Ln Unit 78, Rock Hill, SC 29730 and is currently estimated at $237,638, approximately $219 per square foot. 713 Dalebrook Ln Unit 78 is a home located in York County with nearby schools including Saluda Trail Middle School, South Pointe High School, and York Preparatory Academy.
Ownership History
Date
Name
Owned For
Owner Type
Purchase Details
Closed on
Feb 10, 2022
Sold by
Frances Hinson Mary
Bought by
Hinson Mary Frances
Current Estimated Value
Purchase Details
Closed on
Jun 30, 2021
Sold by
Gaylor Ruth E
Bought by
Hinson Mary Frances and Hinson Gary William
Purchase Details
Closed on
Oct 5, 2016
Sold by
Stephens Mickey R
Bought by
Gaylor Ruth E
Home Financials for this Owner
Home Financials are based on the most recent Mortgage that was taken out on this home.
Original Mortgage
$100,800
Interest Rate
3.43%
Mortgage Type
New Conventional
Purchase Details
Closed on
Apr 2, 2007
Sold by
Thomas Kelli D and Carter Kelli D
Bought by
Stephens Mickey R
Home Financials for this Owner
Home Financials are based on the most recent Mortgage that was taken out on this home.
Original Mortgage
$96,000
Interest Rate
6.15%
Mortgage Type
New Conventional
Create a Home Valuation Report for This Property
The Home Valuation Report is an in-depth analysis detailing your home's value as well as a comparison with similar homes in the area
Home Values in the Area
Average Home Value in this Area
Purchase History
| Date | Buyer | Sale Price | Title Company |
|---|---|---|---|
| Hinson Mary Frances | -- | Trimnal & Myers Llc | |
| Hinson Mary Frances | $182,500 | None Available | |
| Gaylor Ruth E | $112,000 | None Available | |
| Stephens Mickey R | $96,000 | None Available |
Source: Public Records
Mortgage History
| Date | Status | Borrower | Loan Amount |
|---|---|---|---|
| Previous Owner | Gaylor Ruth E | $100,800 | |
| Previous Owner | Stephens Mickey R | $96,000 |
Source: Public Records
Tax History Compared to Growth
Tax History
| Year | Tax Paid | Tax Assessment Tax Assessment Total Assessment is a certain percentage of the fair market value that is determined by local assessors to be the total taxable value of land and additions on the property. | Land | Improvement |
|---|---|---|---|---|
| 2024 | $636 | $6,563 | $920 | $5,643 |
| 2023 | $653 | $6,563 | $920 | $5,643 |
| 2022 | $2,260 | $6,563 | $920 | $5,643 |
| 2021 | -- | $3,703 | $649 | $3,054 |
| 2020 | $530 | $3,703 | $0 | $0 |
| 2019 | $483 | $3,220 | $0 | $0 |
| 2018 | $480 | $3,220 | $0 | $0 |
| 2017 | $629 | $4,480 | $0 | $0 |
| 2016 | $1,525 | $4,830 | $0 | $0 |
| 2014 | $488 | $4,830 | $1,380 | $3,450 |
| 2013 | $488 | $5,730 | $1,380 | $4,350 |
Source: Public Records
Map
Nearby Homes
- 446 Guiness Place
- 1391 Colwick Ln
- 1257 Reese Roach Rd
- 1085 Pinecrest Dr
- 1540 Coatsworth Ln
- 1487 The Crossing
- 1548 Summit View Dr
- 2708 Barwick Ln
- 564 Menzies Dr
- 926 Meadow Lakes Rd
- 1593 Worthington Crossing
- 823 Prestwick Dr
- 309 Haddington Ct
- 1545 Patio Point
- 1650 W Main St
- 1417 Red Oaks Dr
- 1625 Begonia Way
- 720 Herlong Ave
- 861 Carey Dr
- 851 Gist Rd
- 713 Dalebrook Ln
- 711 Dalebrook Ln
- 709 Dalebrook Ln
- 721 Dalebrook Ln
- 705 Dalebrook Ln
- 723 Dalebrook Ln Unit 64
- 703 Dalebrook Ln Unit 83
- 725 Dalebrook Ln
- 710 Dalebrook Ln
- 712 Dalebrook Ln Unit 712
- 708 Dalebrook Ln
- 718 Dalebrook Ln
- 706 Dalebrook Ln
- 706 Dalebrook Ln Unit 2
- 727 Dalebrook Ln
- 720 Dalebrook Ln
- 704 Dalebrook Ln
- 729 Dalebrook Ln
- 212 Baldwin Ct
- 724 Dalebrook Ln