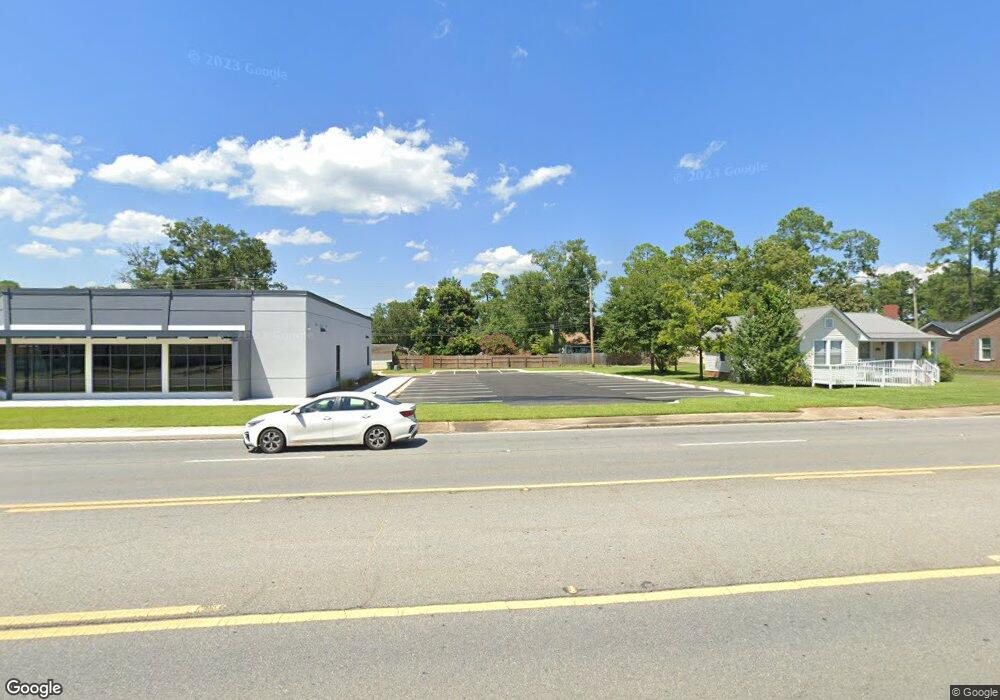
713 E 16th Ave Cordele, GA 31015
Estimated Value: $238,214
3
Beds
1
Bath
1,532
Sq Ft
$155/Sq Ft
Est. Value
About This Home
This home is located at 713 E 16th Ave, Cordele, GA 31015 and is currently estimated at $238,214, approximately $155 per square foot. 713 E 16th Ave is a home located in Crisp County with nearby schools including Crisp County Elementary School, Crisp County Primary School, and Crisp County Middle School.
Ownership History
Date
Name
Owned For
Owner Type
Purchase Details
Closed on
Oct 21, 2022
Sold by
Browning Michael F
Bought by
Careconnect Health Inc
Current Estimated Value
Purchase Details
Closed on
Jan 3, 2007
Sold by
Bagwell Johanna Slenker
Bought by
Browning Michael F
Purchase Details
Closed on
May 29, 2003
Sold by
Slenker Robert and Slenker Naom
Bought by
Bagwell Johanna Slenker
Purchase Details
Closed on
Mar 9, 1990
Bought by
Slenker Robert and Slenker Naom
Purchase Details
Closed on
Apr 22, 1957
Bought by
Slenker Robert E
Create a Home Valuation Report for This Property
The Home Valuation Report is an in-depth analysis detailing your home's value as well as a comparison with similar homes in the area
Purchase History
| Date | Buyer | Sale Price | Title Company |
|---|---|---|---|
| Careconnect Health Inc | $220,000 | -- | |
| Browning Michael F | $120,000 | -- | |
| Bagwell Johanna Slenker | -- | -- | |
| Slenker Robert | -- | -- | |
| Slenker Robert E | -- | -- |
Source: Public Records
Mortgage History
| Date | Status | Borrower | Loan Amount |
|---|---|---|---|
| Closed | Browning Michael F | $0 |
Source: Public Records
Tax History
| Year | Tax Paid | Tax Assessment Tax Assessment Total Assessment is a certain percentage of the fair market value that is determined by local assessors to be the total taxable value of land and additions on the property. | Land | Improvement |
|---|---|---|---|---|
| 2025 | $2,481 | $70,340 | $60,456 | $9,884 |
| 2024 | $2,521 | $70,340 | $60,456 | $9,884 |
| 2023 | $3,299 | $106,064 | $65,952 | $40,112 |
| 2022 | $1,216 | $46,000 | $30,228 | $15,772 |
| 2021 | $1,191 | $46,000 | $30,228 | $15,772 |
| 2020 | $1,295 | $46,000 | $30,228 | $15,772 |
| 2019 | $1,305 | $46,000 | $30,228 | $15,772 |
| 2018 | $1,295 | $43,922 | $16,817 | $27,105 |
| 2017 | $1,784 | $43,922 | $16,817 | $27,105 |
| 2016 | $1,299 | $43,922 | $16,817 | $27,105 |
| 2015 | -- | $43,922 | $16,817 | $27,105 |
| 2014 | -- | $43,922 | $16,817 | $27,105 |
| 2013 | -- | $43,922 | $16,816 | $27,105 |
Source: Public Records
Map
Nearby Homes
Your Personal Tour Guide
Ask me questions while you tour the home.