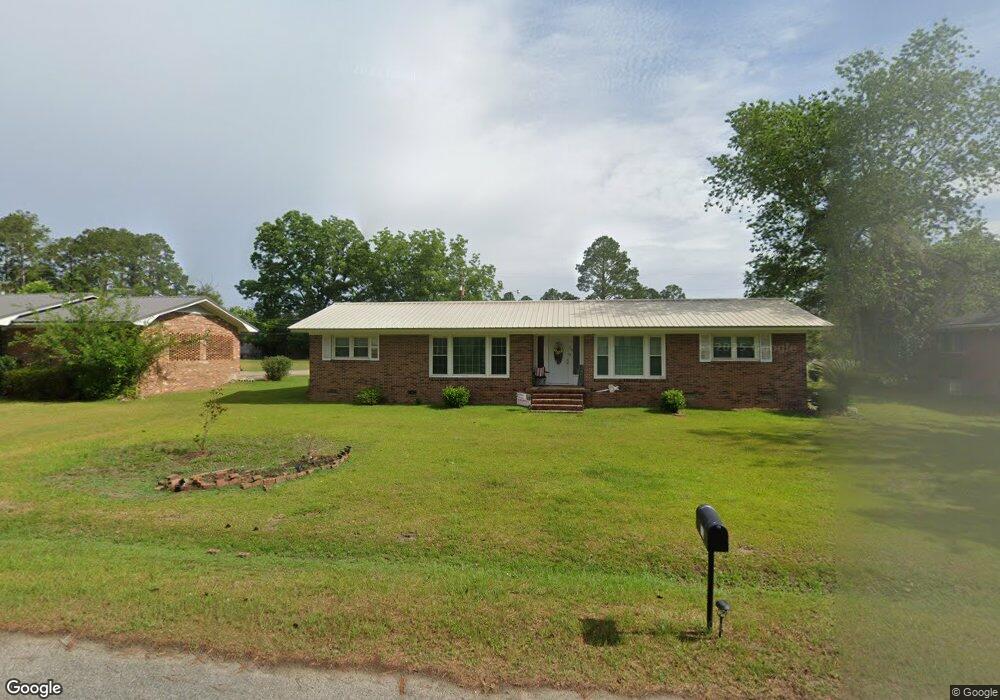
713 E 29th Ave Cordele, GA 31015
Estimated Value: $140,527 - $202,000
3
Beds
2
Baths
1,771
Sq Ft
$100/Sq Ft
Est. Value
About This Home
This home is located at 713 E 29th Ave, Cordele, GA 31015 and is currently estimated at $176,632, approximately $99 per square foot. 713 E 29th Ave is a home located in Crisp County with nearby schools including Crisp County Elementary School, Crisp County Primary School, and Crisp County Middle School.
Ownership History
Date
Name
Owned For
Owner Type
Purchase Details
Closed on
Oct 15, 2018
Sold by
Hancock Mcnair E
Bought by
Nipper Billy W
Current Estimated Value
Purchase Details
Closed on
Jul 11, 1972
Bought by
Hancock Mcnair E
Create a Home Valuation Report for This Property
The Home Valuation Report is an in-depth analysis detailing your home's value as well as a comparison with similar homes in the area
Purchase History
| Date | Buyer | Sale Price | Title Company |
|---|---|---|---|
| Nipper Billy W | $50,000 | -- | |
| Hancock Mcnair E | -- | -- |
Source: Public Records
Tax History
| Year | Tax Paid | Tax Assessment Tax Assessment Total Assessment is a certain percentage of the fair market value that is determined by local assessors to be the total taxable value of land and additions on the property. | Land | Improvement |
|---|---|---|---|---|
| 2025 | $1,804 | $51,138 | $2,000 | $49,138 |
| 2024 | $1,652 | $46,088 | $2,000 | $44,088 |
| 2023 | $1,635 | $43,596 | $2,000 | $41,596 |
| 2022 | $1,086 | $41,071 | $2,000 | $39,071 |
| 2021 | $1,064 | $38,545 | $2,000 | $36,545 |
| 2020 | $1,085 | $38,545 | $2,000 | $36,545 |
| 2019 | $567 | $38,545 | $2,000 | $36,545 |
| 2018 | $1,062 | $36,044 | $3,200 | $32,844 |
| 2017 | $1,464 | $36,044 | $3,200 | $32,844 |
| 2016 | $1,066 | $36,044 | $3,200 | $32,844 |
| 2015 | -- | $36,044 | $3,200 | $32,844 |
| 2014 | -- | $36,044 | $3,200 | $32,844 |
| 2013 | -- | $36,043 | $3,200 | $32,843 |
Source: Public Records
Map
Nearby Homes
- 709 E 29th Ave
- 715 E 29th Ave
- 1026 29th Ave E
- 29th 29th Ave E
- E 29th Ave E
- 712 E 28th Ave
- 714 E 28th Ave
- 705 E 29th Ave
- 721 E 29th Ave
- 716 E 29th Ave
- 710 E 28th Ave
- 710 E 29th Ave
- 716 E 28th Ave
- 722 E 29th Ave
- 601 28th Ave E
- 702 E 29th Ave
- 1809 S Hickory St
- 1803 S 1st St
- 713 E 28th Ave
- 709 E 30th Ave
Your Personal Tour Guide
Ask me questions while you tour the home.