Estimated Value: $621,907 - $712,000
3
Beds
3
Baths
3,486
Sq Ft
$196/Sq Ft
Est. Value
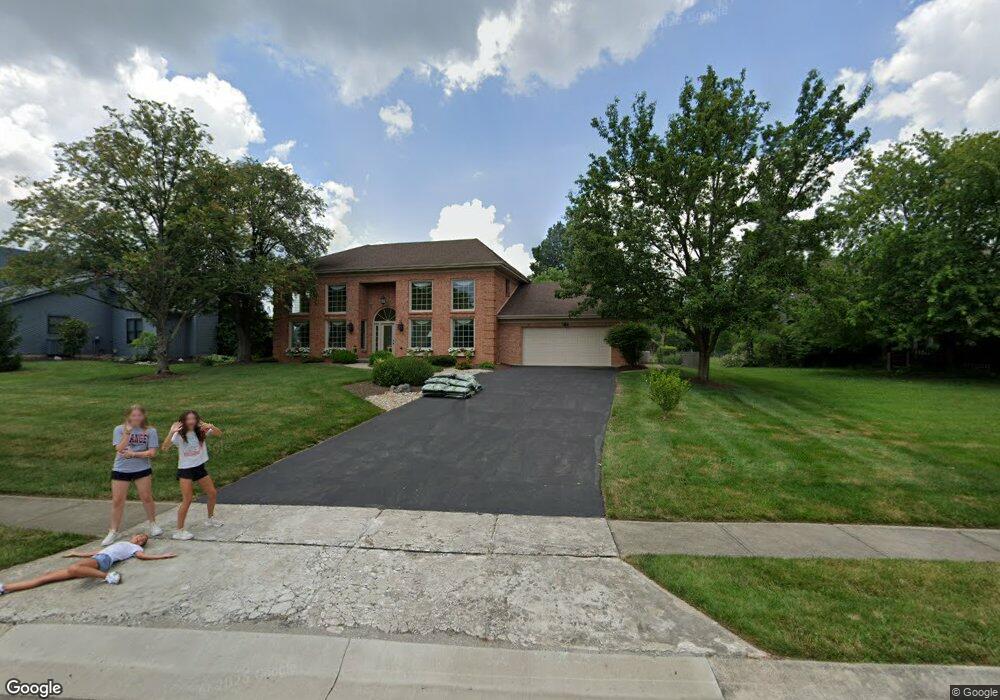
About This Home
This home is located at 713 Eagle View Ct, Mason, OH 45040 and is currently estimated at $684,977, approximately $196 per square foot. 713 Eagle View Ct is a home located in Warren County with nearby schools including Mason Intermediate Elementary School, Mason Middle School, and William Mason High School.
Ownership History
Date
Name
Owned For
Owner Type
Purchase Details
Closed on
Aug 1, 1997
Sold by
Martens Darnell H
Bought by
Peters David P and Peters Sharon M
Current Estimated Value
Home Financials for this Owner
Home Financials are based on the most recent Mortgage that was taken out on this home.
Original Mortgage
$252,000
Outstanding Balance
$28,916
Interest Rate
7.13%
Mortgage Type
New Conventional
Estimated Equity
$656,061
Purchase Details
Closed on
Apr 27, 1987
Sold by
Lack Richard V and Lack Barbara
Bought by
Martens and Martens Darnell H
Purchase Details
Closed on
Jun 10, 1985
Sold by
James V Mc Carty & Inc
Bought by
Lack Lack and Lack Richard V
Purchase Details
Closed on
Mar 15, 1984
Sold by
Kings Island Real Estate
Bought by
James V Mc Carty & Inc
Purchase Details
Closed on
Dec 21, 1983
Sold by
Kings Island Real Estate
Bought by
Kings Island Real Estate
Create a Home Valuation Report for This Property
The Home Valuation Report is an in-depth analysis detailing your home's value as well as a comparison with similar homes in the area
Home Values in the Area
Average Home Value in this Area
Purchase History
| Date | Buyer | Sale Price | Title Company |
|---|---|---|---|
| Peters David P | $280,000 | -- | |
| Martens | $208,000 | -- | |
| Lack Lack | $188,000 | -- | |
| James V Mc Carty & Inc | $35,000 | -- | |
| Kings Island Real Estate | -- | -- |
Source: Public Records
Mortgage History
| Date | Status | Borrower | Loan Amount |
|---|---|---|---|
| Open | Peters David P | $252,000 |
Source: Public Records
Tax History
| Year | Tax Paid | Tax Assessment Tax Assessment Total Assessment is a certain percentage of the fair market value that is determined by local assessors to be the total taxable value of land and additions on the property. | Land | Improvement |
|---|---|---|---|---|
| 2025 | $7,319 | $180,270 | $38,500 | $141,770 |
| 2024 | $7,319 | $180,270 | $38,500 | $141,770 |
| 2023 | $6,460 | $134,372 | $21,175 | $113,197 |
| 2022 | $6,376 | $134,372 | $21,175 | $113,197 |
| 2021 | $6,040 | $134,372 | $21,175 | $113,197 |
| 2020 | $6,405 | $122,157 | $19,250 | $102,907 |
| 2019 | $5,889 | $122,157 | $19,250 | $102,907 |
| 2018 | $5,908 | $122,157 | $19,250 | $102,907 |
| 2017 | $5,409 | $104,395 | $16,765 | $87,630 |
| 2016 | $5,571 | $104,395 | $16,765 | $87,630 |
| 2015 | $5,583 | $104,395 | $16,765 | $87,630 |
| 2014 | $5,813 | $101,350 | $16,280 | $85,080 |
| 2013 | $5,826 | $119,880 | $19,250 | $100,630 |
Source: Public Records
Map
Nearby Homes
- 6416 Eagleview Dr
- 602 Bunker Ln
- 618 Bunker Ln
- 3634 Pebble Creek Ct
- 382 Walnut Ln
- 3856 Sandtrap Cir
- 6510 Prestwick Ct
- 5921 Fairway Dr
- 5873 Falling Brook Dr
- 4019 Fieldsedge Dr
- 4109 Old Manchester Ct
- 6768 Pondfield Ln Unit 271E
- 6764 Pondfield Ln
- 4202 E Village Dr
- 6674 Villager Place Unit 153D
- 5399 Country Ridge Dr
- 5276 Bay Pointe Dr
- 5533 Cox-Smith Rd
- 5523 Cox-Smith Rd
- 5513 Cox-Smith Rd
- 713 Eagleview Ct
- 715 Eagleview Ct
- 715 Eagle View Ct
- 711 Eagleview Ct
- 717 Eagleview Ct
- 709 Eagleview Ct
- 712 Eagle View Ct
- 716 Eagleview Ct
- 714 Eagleview Ct
- 710 Eagle View Ct
- 712 Eagleview Ct
- 707 Eagleview Ct
- 719 Eagle View Ct
- 718 Eagleview Ct
- 718 Eagle View Ct
- 710 Eagleview Ct
- 708 Eagle View Ct
- 719 Eagleview Ct
- 708 Eagleview Ct
- 705 Eagleview Ct
Your Personal Tour Guide
Ask me questions while you tour the home.