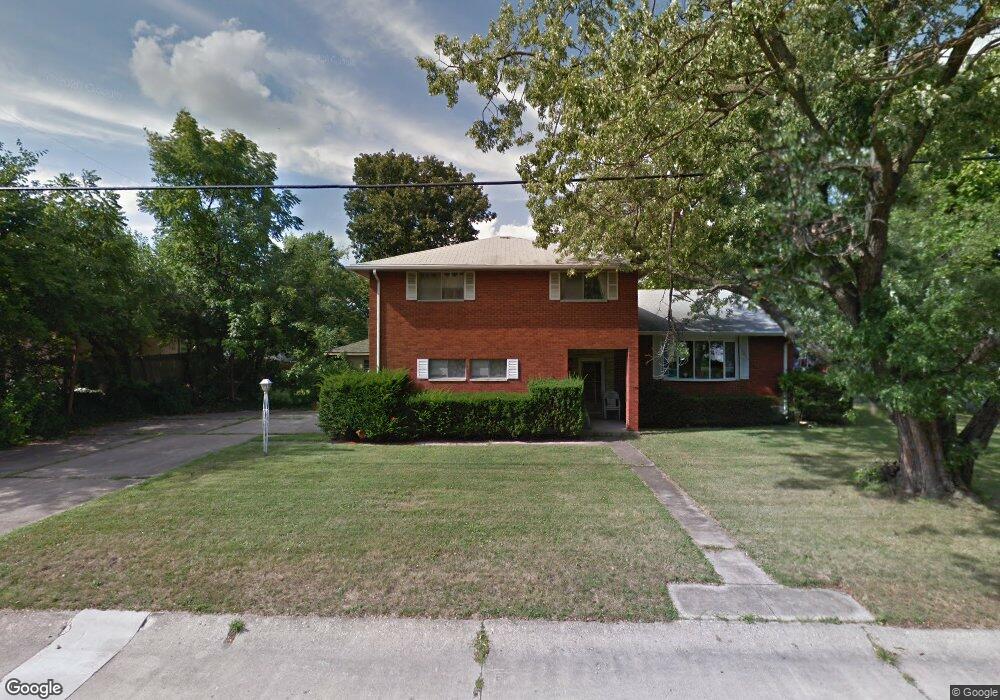
713 East Dr Dayton, OH 45419
Estimated Value: $267,000 - $300,000
4
Beds
3
Baths
1,834
Sq Ft
$154/Sq Ft
Est. Value
About This Home
This home is located at 713 East Dr, Dayton, OH 45419 and is currently estimated at $281,887, approximately $153 per square foot. 713 East Dr is a home located in Montgomery County with nearby schools including Orchard Park Elementary School, Van Buren Middle School, and Kettering Fairmont High School.
Ownership History
Date
Name
Owned For
Owner Type
Purchase Details
Closed on
Nov 29, 2005
Sold by
Sosnowski Genevieve B
Bought by
Sosnowski Genevieve B and Sweezy Karen J
Current Estimated Value
Purchase Details
Closed on
Feb 13, 2003
Sold by
Sosnowski Edward K and Sosnowski Genevieve B
Bought by
Sosnowski Edward K and Sosnowski Genevieve B
Create a Home Valuation Report for This Property
The Home Valuation Report is an in-depth analysis detailing your home's value as well as a comparison with similar homes in the area
Home Values in the Area
Average Home Value in this Area
Purchase History
| Date | Buyer | Sale Price | Title Company |
|---|---|---|---|
| Sosnowski Genevieve B | -- | None Available | |
| Sosnowski Edward K | -- | -- |
Source: Public Records
Tax History Compared to Growth
Tax History
| Year | Tax Paid | Tax Assessment Tax Assessment Total Assessment is a certain percentage of the fair market value that is determined by local assessors to be the total taxable value of land and additions on the property. | Land | Improvement |
|---|---|---|---|---|
| 2024 | $4,998 | $78,980 | $10,960 | $68,020 |
| 2023 | $4,998 | $78,980 | $10,960 | $68,020 |
| 2022 | $4,750 | $59,390 | $8,240 | $51,150 |
| 2021 | $4,400 | $59,390 | $8,240 | $51,150 |
| 2020 | $4,414 | $59,390 | $8,240 | $51,150 |
| 2019 | $3,999 | $47,560 | $7,480 | $40,080 |
| 2018 | $4,020 | $47,560 | $7,480 | $40,080 |
| 2017 | $3,711 | $47,560 | $7,480 | $40,080 |
| 2016 | $3,884 | $46,790 | $7,480 | $39,310 |
| 2015 | $3,716 | $46,790 | $7,480 | $39,310 |
| 2014 | $3,716 | $46,790 | $7,480 | $39,310 |
| 2012 | -- | $50,660 | $7,480 | $43,180 |
Source: Public Records
Map
Nearby Homes
- 709 E Dorothy Ln
- 663 Broad Blvd
- 2817 Royalston Ave
- 651 Broad Blvd
- 2820 Wehrly Ave
- 813 Rockhill Ave
- 2905 Acorn Dr
- 2601 Oakley Ave
- 962 Broad Blvd
- 2701 Aerial Ave
- 587 Cottingwood Ct
- 2551 Acorn Dr
- 3209 Waltham Ave
- 441 Cushing Ave
- 813 Timberlake Ct
- 545 Monteray Ave
- 900 Garrison Ave
- 861 Timberlake Ct
- 856 Timberlake Ct
- 503 Cottingwood Ct
- 2821 California Ave
- 709 East Dr
- 710 East Dr
- 2817 California Ave
- 704 East Dr
- 705 East Dr
- 2824 California Ave
- 2900 California Ave
- 2816 California Ave
- 2905 California Ave
- 2812 Hazelwood Ave
- 2816 Hazelwood Ave
- 2809 California Ave
- 2812 California Ave
- 2908 California Ave
- 2808 Hazelwood Ave
- 2909 California Ave
- 2805 California Ave
- 2808 California Ave
- 2900 Hazelwood Ave