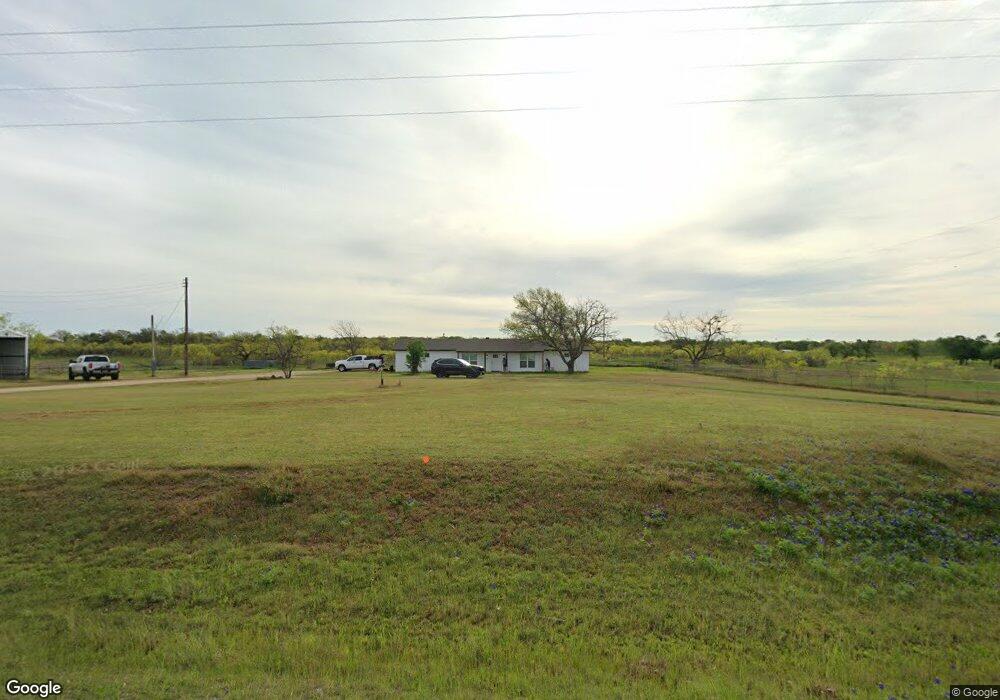
713 Fannin St Millsap, TX 76066
Estimated Value: $653,000
--
Bed
--
Bath
1,665
Sq Ft
$392/Sq Ft
Est. Value
About This Home
This home is located at 713 Fannin St, Millsap, TX 76066 and is currently estimated at $653,000, approximately $392 per square foot. 713 Fannin St is a home located in Parker County with nearby schools including Millsap Elementary School, Millsap Middle School, and Millsap High School.
Ownership History
Date
Name
Owned For
Owner Type
Purchase Details
Closed on
Jun 29, 2023
Sold by
Barnes Susie and Guess Charles Anthony
Bought by
Boedeker Wesley Eugene and Boedeker Courtney
Current Estimated Value
Home Financials for this Owner
Home Financials are based on the most recent Mortgage that was taken out on this home.
Original Mortgage
$513,000
Outstanding Balance
$499,826
Interest Rate
6.39%
Mortgage Type
New Conventional
Estimated Equity
$153,174
Purchase Details
Closed on
Nov 4, 2011
Sold by
The Odell C & Dorotha A Guess Revocable
Bought by
Guess Dorotha A
Purchase Details
Closed on
Nov 12, 1998
Bought by
Guess Dorotha A Life Estate
Purchase Details
Closed on
Jan 1, 1901
Bought by
Guess Dorotha A Life Estate
Create a Home Valuation Report for This Property
The Home Valuation Report is an in-depth analysis detailing your home's value as well as a comparison with similar homes in the area
Home Values in the Area
Average Home Value in this Area
Purchase History
| Date | Buyer | Sale Price | Title Company |
|---|---|---|---|
| Boedeker Wesley Eugene | -- | None Listed On Document | |
| Guess Dorotha A | -- | None Available | |
| Guess Dorotha A Life Estate | -- | -- | |
| Guess Dorotha A Life Estate | -- | -- |
Source: Public Records
Mortgage History
| Date | Status | Borrower | Loan Amount |
|---|---|---|---|
| Open | Boedeker Wesley Eugene | $513,000 |
Source: Public Records
Tax History Compared to Growth
Tax History
| Year | Tax Paid | Tax Assessment Tax Assessment Total Assessment is a certain percentage of the fair market value that is determined by local assessors to be the total taxable value of land and additions on the property. | Land | Improvement |
|---|---|---|---|---|
| 2025 | $292 | $54,329 | -- | -- |
| 2024 | $292 | $49,390 | $21,880 | $27,510 |
| 2023 | $292 | $170,330 | $0 | $0 |
| 2022 | $2,938 | $191,510 | $12,000 | $179,510 |
| 2021 | $2,929 | $191,510 | $12,000 | $179,510 |
| 2020 | $2,754 | $174,640 | $9,390 | $165,250 |
| 2019 | $2,684 | $174,640 | $9,390 | $165,250 |
| 2018 | $2,468 | $149,260 | $7,000 | $142,260 |
| 2017 | $2,323 | $149,260 | $7,000 | $142,260 |
| 2016 | $2,112 | $98,530 | $6,200 | $92,330 |
| 2015 | $612 | $98,530 | $6,200 | $92,330 |
| 2014 | $750 | $72,240 | $5,500 | $66,740 |
Source: Public Records
Map
Nearby Homes
- 3499 S Fm 113
- Farm To Market 113
- 106 S Houston St
- 207 NE Front St
- 211 N Cherry St
- 1950 Consolation Dr
- 811 NE Front St
- 9999 Trails End Cir
- 250 Young Rd
- 417 Wood River Rd
- 2500 Cool Jct Unit Tract 2
- 1923 Wilson Bend Rd
- 555 Sunset Trail
- 1350 Stephens Rd
- 000a Wilson Bend Rd
- 000b Wilson Bend Rd
- 4962 S Fm 113
- 320 Wilson Bend Rd
- 2710 Fairview Rd
- 2101 Cool Jct
- 710 Fannin St
- 790 Fannin St
- 610 Fannin St
- 207 White Bull Ln
- 602 Fannin St
- 600 Fannin St
- 00 White Bull Ln
- 107 W Lee St
- 210 White Bull Ln
- 508 Fannin St
- 115 W Lee St
- 111 W Davis Cir
- 504 Fannin St
- 110 W Davis Cir
- 304 Strain Rd
- 502 Fannin St
- 441 White Bull Ln
- 500 Fannin St
- 510 Palo Pinto St
- 505 Palo Pinto St