Estimated Value: $146,000 - $180,000
4
Beds
1
Bath
1,988
Sq Ft
$83/Sq Ft
Est. Value
About This Home
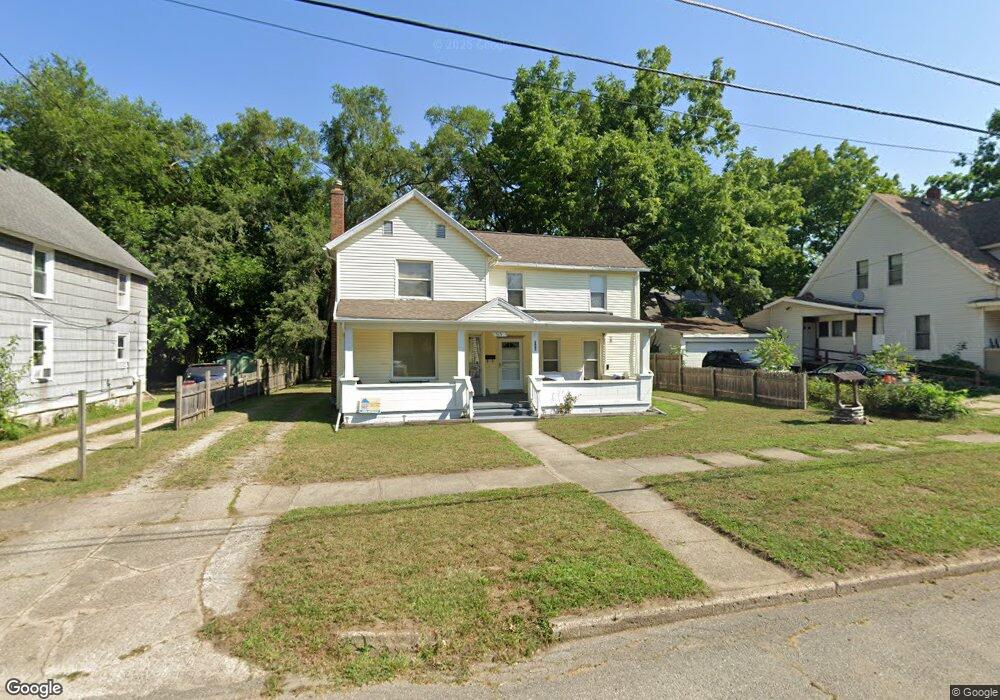
This home is located at 713 Ferry St, Niles, MI 49120 and is currently estimated at $164,985, approximately $82 per square foot. 713 Ferry St is a home located in Berrien County with nearby schools including Ballard Elementary School, Ring Lardner Middle School, and Oak Manor Sixth Grade Center.
Ownership History
Date
Name
Owned For
Owner Type
Purchase Details
Closed on
Nov 1, 2019
Sold by
Webb Dora
Bought by
Webb Dora
Current Estimated Value
Purchase Details
Closed on
Jul 2, 2009
Sold by
Idd Far Inc
Bought by
Webb Dora
Home Financials for this Owner
Home Financials are based on the most recent Mortgage that was taken out on this home.
Original Mortgage
$25,400
Outstanding Balance
$16,586
Interest Rate
5.32%
Mortgage Type
Unknown
Estimated Equity
$148,399
Purchase Details
Closed on
Sep 30, 2003
Sold by
Davis Nann Hess
Bought by
Idd Far Inc
Create a Home Valuation Report for This Property
The Home Valuation Report is an in-depth analysis detailing your home's value as well as a comparison with similar homes in the area
Home Values in the Area
Average Home Value in this Area
Purchase History
| Date | Buyer | Sale Price | Title Company |
|---|---|---|---|
| Webb Dora | -- | None Available | |
| Webb Dora | $63,500 | Metropolitan Title Company | |
| Idd Far Inc | -- | -- |
Source: Public Records
Mortgage History
| Date | Status | Borrower | Loan Amount |
|---|---|---|---|
| Open | Webb Dora | $25,400 |
Source: Public Records
Tax History Compared to Growth
Tax History
| Year | Tax Paid | Tax Assessment Tax Assessment Total Assessment is a certain percentage of the fair market value that is determined by local assessors to be the total taxable value of land and additions on the property. | Land | Improvement |
|---|---|---|---|---|
| 2025 | $1,329 | $78,900 | $0 | $0 |
| 2024 | $1,041 | $70,200 | $0 | $0 |
| 2023 | $998 | $48,900 | $0 | $0 |
| 2022 | $950 | $37,700 | $0 | $0 |
| 2021 | $1,168 | $35,000 | $3,100 | $31,900 |
| 2020 | $1,155 | $33,400 | $0 | $0 |
| 2019 | $1,141 | $29,100 | $2,000 | $27,100 |
| 2018 | $1,109 | $29,100 | $0 | $0 |
| 2017 | $1,100 | $34,900 | $0 | $0 |
| 2016 | $1,044 | $30,900 | $0 | $0 |
| 2015 | $1,041 | $30,200 | $0 | $0 |
| 2014 | $811 | $28,000 | $0 | $0 |
Source: Public Records
Map
Nearby Homes