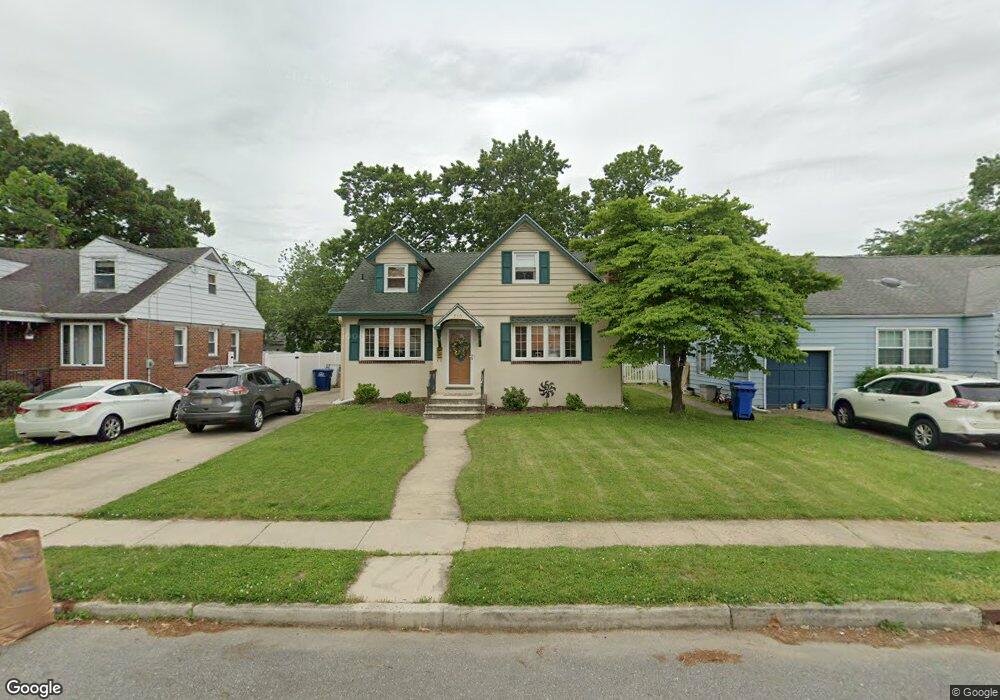
713 Filbert St Palmyra, NJ 08065
Estimated Value: $342,000 - $393,000
Studio
--
Bath
1,312
Sq Ft
$277/Sq Ft
Est. Value
About This Home
This home is located at 713 Filbert St, Palmyra, NJ 08065 and is currently estimated at $363,358, approximately $276 per square foot. 713 Filbert St is a home located in Burlington County with nearby schools including Charles Street School, Palmyra Middle School, and Palmyra High School.
Ownership History
Date
Name
Owned For
Owner Type
Purchase Details
Closed on
Jun 5, 2015
Sold by
Kish Denise A
Bought by
Kish Denise A
Current Estimated Value
Home Financials for this Owner
Home Financials are based on the most recent Mortgage that was taken out on this home.
Original Mortgage
$158,221
Outstanding Balance
$121,508
Interest Rate
3.99%
Mortgage Type
FHA
Estimated Equity
$241,850
Purchase Details
Closed on
Nov 5, 2004
Sold by
Camillo Linda and Desher Elizabeth
Bought by
Kish John T and Kish Denise A
Home Financials for this Owner
Home Financials are based on the most recent Mortgage that was taken out on this home.
Original Mortgage
$136,500
Interest Rate
5.75%
Mortgage Type
Purchase Money Mortgage
Purchase Details
Closed on
Apr 22, 1996
Sold by
Camillo Linda M
Bought by
Camillo Linda M and Desher Elizabeth M
Create a Home Valuation Report for This Property
The Home Valuation Report is an in-depth analysis detailing your home's value as well as a comparison with similar homes in the area
Home Values in the Area
Average Home Value in this Area
Purchase History
| Date | Buyer | Sale Price | Title Company |
|---|---|---|---|
| Kish Denise A | -- | I Abstract & Title Agency | |
| Kish John T | $182,000 | Affiliated Title Of South Je | |
| Camillo Linda M | -- | Surety Title Corporation |
Source: Public Records
Mortgage History
| Date | Status | Borrower | Loan Amount |
|---|---|---|---|
| Open | Kish Denise A | $158,221 | |
| Closed | Kish John T | $136,500 |
Source: Public Records
Tax History
| Year | Tax Paid | Tax Assessment Tax Assessment Total Assessment is a certain percentage of the fair market value that is determined by local assessors to be the total taxable value of land and additions on the property. | Land | Improvement |
|---|---|---|---|---|
| 2025 | $7,870 | $182,000 | $60,000 | $122,000 |
| 2024 | $7,706 | $182,000 | $60,000 | $122,000 |
| 2023 | $7,706 | $182,000 | $60,000 | $122,000 |
| 2022 | $7,524 | $182,000 | $60,000 | $122,000 |
| 2021 | $6,776 | $182,000 | $60,000 | $122,000 |
| 2020 | $7,289 | $182,000 | $60,000 | $122,000 |
| 2019 | $7,060 | $182,000 | $60,000 | $122,000 |
| 2018 | $6,960 | $182,000 | $60,000 | $122,000 |
| 2017 | $6,871 | $182,000 | $60,000 | $122,000 |
| 2016 | $6,736 | $182,000 | $60,000 | $122,000 |
| 2015 | $6,639 | $182,000 | $60,000 | $122,000 |
| 2014 | $6,346 | $182,000 | $60,000 | $122,000 |
Source: Public Records
Map
Nearby Homes
- 726 Pennsylvania Ave
- 607 New Jersey Ave
- 514 Race St
- 162 Oxford Rd
- 313 Delaware Ave
- 168 Fairfax Dr
- 43 Rowland St
- 900 Parry Ave
- 43 E Henry St
- 412 Horace Ave
- 235 Horace Ave
- 414 Leconey Ave
- 505 Orchard Ave
- 619 Morgan Ave
- 502 Cinnaminson Ave
- 420 Cinnaminson Ave
- 221 W 3rd St
- 405 Elm Ave
- 1611 Adams St
- 3037 Harbour Dr
Your Personal Tour Guide
Ask me questions while you tour the home.