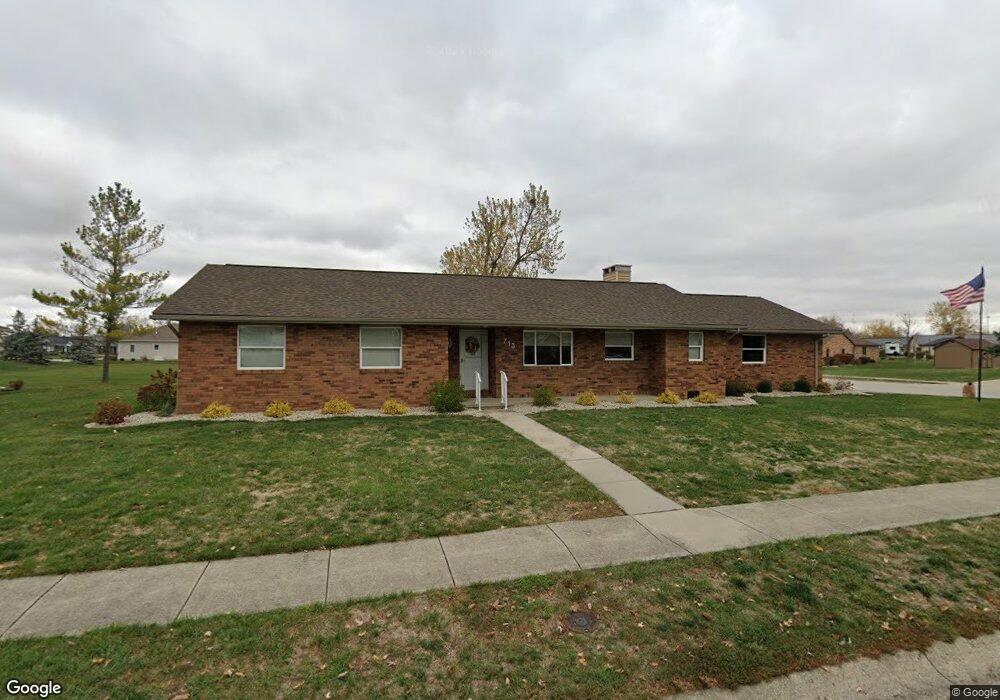
713 Fleck Ave Celina, OH 45822
Estimated Value: $241,428 - $303,000
3
Beds
2
Baths
1,531
Sq Ft
$171/Sq Ft
Est. Value
About This Home
This home is located at 713 Fleck Ave, Celina, OH 45822 and is currently estimated at $262,107, approximately $171 per square foot. 713 Fleck Ave is a home located in Mercer County with nearby schools including Celina Middle School, Celina High School, and Immaculate Conception School.
Ownership History
Date
Name
Owned For
Owner Type
Purchase Details
Closed on
Oct 27, 2021
Sold by
Iron Gate Investments Llc
Bought by
Thomas Gregory W and Thomas Judith A
Current Estimated Value
Purchase Details
Closed on
Jan 24, 2008
Sold by
Jones Susan R and Jones Thomas O
Bought by
Jones Susan R and Jones Thomas O
Home Financials for this Owner
Home Financials are based on the most recent Mortgage that was taken out on this home.
Original Mortgage
$167,652
Interest Rate
5.9%
Mortgage Type
FHA
Purchase Details
Closed on
Mar 21, 2006
Sold by
Wendel Derek B
Bought by
Wendel Susan R
Purchase Details
Closed on
Sep 27, 2005
Sold by
Wendel Susan
Bought by
Wendel Susan and Wendel Derek
Create a Home Valuation Report for This Property
The Home Valuation Report is an in-depth analysis detailing your home's value as well as a comparison with similar homes in the area
Home Values in the Area
Average Home Value in this Area
Purchase History
| Date | Buyer | Sale Price | Title Company |
|---|---|---|---|
| Thomas Gregory W | $200,566 | Abels Erin M | |
| Jones Susan R | -- | Attorney | |
| Wendel Susan R | -- | None Available | |
| Wendel Susan | -- | Attorney |
Source: Public Records
Mortgage History
| Date | Status | Borrower | Loan Amount |
|---|---|---|---|
| Previous Owner | Jones Susan R | $167,652 |
Source: Public Records
Tax History
| Year | Tax Paid | Tax Assessment Tax Assessment Total Assessment is a certain percentage of the fair market value that is determined by local assessors to be the total taxable value of land and additions on the property. | Land | Improvement |
|---|---|---|---|---|
| 2025 | $2,219 | $66,080 | $10,850 | $55,230 |
| 2024 | $2,212 | $66,080 | $10,850 | $55,230 |
| 2023 | $2,219 | $66,080 | $10,850 | $55,230 |
| 2022 | $1,720 | $46,830 | $10,500 | $36,330 |
| 2021 | $1,763 | $46,830 | $10,500 | $36,330 |
| 2020 | $1,825 | $46,830 | $10,500 | $36,330 |
| 2019 | $1,712 | $41,230 | $9,380 | $31,850 |
| 2018 | $1,780 | $41,230 | $9,380 | $31,850 |
| 2017 | $1,696 | $41,230 | $9,380 | $31,850 |
| 2016 | $1,612 | $37,770 | $8,720 | $29,050 |
| 2015 | $1,565 | $37,740 | $8,720 | $29,020 |
| 2014 | $1,525 | $37,740 | $8,720 | $29,020 |
| 2013 | $1,801 | $41,940 | $9,700 | $32,240 |
Source: Public Records
Map
Nearby Homes
- 1312 Michael Ave
- 1001 N Sugar St
- 908 N Sugar St
- 906 N Sugar St
- 905 N Walnut St
- 115 Touvelle St
- 680 N Main St
- 206 Magnolia St
- 116 S Elm St
- 308 Dogwood Dr
- 316 Dogwood Dr
- 120 E Blake St
- 609 N Cherry St
- 1021 Hemlock St
- 1109 Shimp Dr
- 328 E Livingston St
- 526 Willow St
- 319 E Fayette St
- 1201 Lilac Dr
- 1018 Lilac St
Your Personal Tour Guide
Ask me questions while you tour the home.