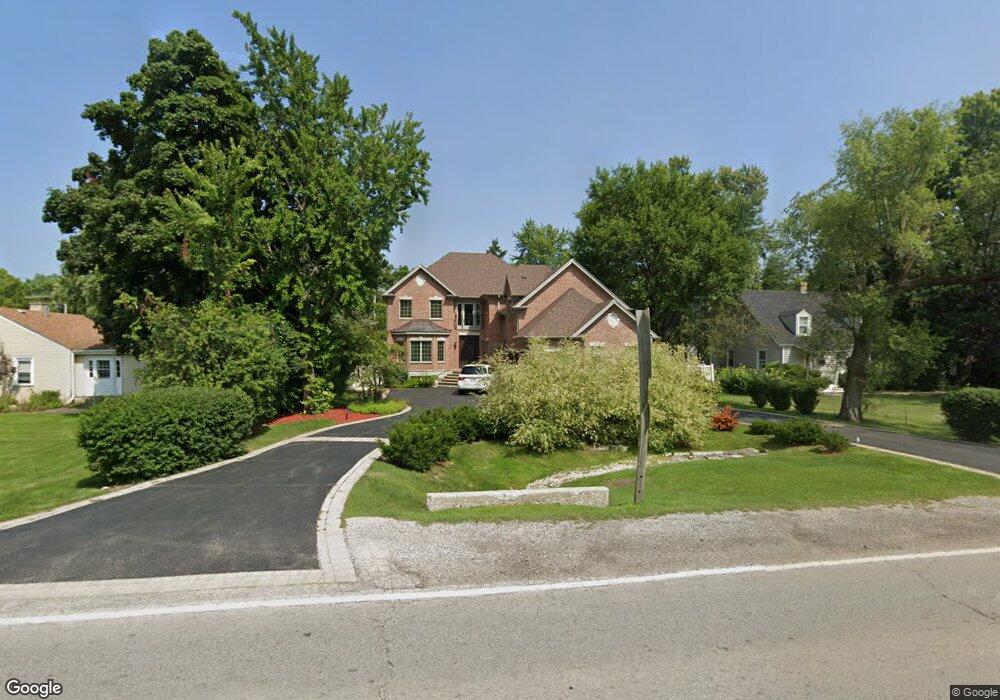
713 Greenwood Rd Unit A Glenview, IL 60025
Estimated Value: $1,160,000 - $1,323,000
5
Beds
6
Baths
3,600
Sq Ft
$345/Sq Ft
Est. Value
About This Home
This home is located at 713 Greenwood Rd Unit A, Glenview, IL 60025 and is currently estimated at $1,241,335, approximately $344 per square foot. 713 Greenwood Rd Unit A is a home located in Cook County with nearby schools including Henking Elementary School, Hoffman Elementary School, and Attea Middle School.
Ownership History
Date
Name
Owned For
Owner Type
Purchase Details
Closed on
Sep 20, 2020
Sold by
Jacob Joy and Jacob Ancy C
Bought by
George Jiju
Current Estimated Value
Home Financials for this Owner
Home Financials are based on the most recent Mortgage that was taken out on this home.
Original Mortgage
$628,000
Interest Rate
2.7%
Mortgage Type
New Conventional
Purchase Details
Closed on
Mar 30, 2005
Sold by
Maliakal Accamma V
Bought by
Joy Jacob Ancy C and Joy Jacob
Home Financials for this Owner
Home Financials are based on the most recent Mortgage that was taken out on this home.
Original Mortgage
$266,000
Interest Rate
4.12%
Mortgage Type
Unknown
Purchase Details
Closed on
Aug 15, 2002
Sold by
Sharifi Vahid and Sharifi Mohsen
Bought by
Maliakal Accamma V
Home Financials for this Owner
Home Financials are based on the most recent Mortgage that was taken out on this home.
Original Mortgage
$198,000
Interest Rate
5.25%
Mortgage Type
Unknown
Create a Home Valuation Report for This Property
The Home Valuation Report is an in-depth analysis detailing your home's value as well as a comparison with similar homes in the area
Home Values in the Area
Average Home Value in this Area
Purchase History
| Date | Buyer | Sale Price | Title Company |
|---|---|---|---|
| George Jiju | $786,500 | Chicago Title | |
| Joy Jacob Ancy C | $333,000 | Rtc | |
| Maliakal Accamma V | $220,000 | Burnet Title Llc |
Source: Public Records
Mortgage History
| Date | Status | Borrower | Loan Amount |
|---|---|---|---|
| Previous Owner | George Jiju | $628,000 | |
| Previous Owner | Joy Jacob Ancy C | $266,000 | |
| Previous Owner | Maliakal Accamma V | $198,000 |
Source: Public Records
Tax History Compared to Growth
Tax History
| Year | Tax Paid | Tax Assessment Tax Assessment Total Assessment is a certain percentage of the fair market value that is determined by local assessors to be the total taxable value of land and additions on the property. | Land | Improvement |
|---|---|---|---|---|
| 2024 | $16,845 | $78,650 | $12,375 | $66,275 |
| 2023 | $16,063 | $78,650 | $12,375 | $66,275 |
| 2022 | $16,063 | $78,650 | $12,375 | $66,275 |
| 2021 | $15,361 | $65,641 | $8,437 | $57,204 |
| 2020 | $16,933 | $69,626 | $8,437 | $61,189 |
| 2019 | $15,936 | $77,363 | $8,437 | $68,926 |
| 2018 | $19,693 | $86,512 | $7,312 | $79,200 |
| 2017 | $19,121 | $86,512 | $7,312 | $79,200 |
| 2016 | $18,038 | $86,512 | $7,312 | $79,200 |
| 2015 | $17,590 | $75,350 | $5,906 | $69,444 |
| 2014 | $17,321 | $75,350 | $5,906 | $69,444 |
| 2013 | $16,773 | $75,350 | $5,906 | $69,444 |
Source: Public Records
Map
Nearby Homes
- 616 Glendale Rd
- 705 Glendale Rd
- 608 Glenwood Ln
- 3505 Linneman St
- 400 Glendale Rd
- 3335 Elmdale Rd
- 509 Elder Ln
- 518 Elder Ln
- 533 Cherry Ln
- 3420 Greenbriar Dr
- 401 Greenwood Rd
- 1045 Crystal Ct
- 329 Cherry Ct
- 3200 Thornberry Ln
- 342 Cherry Ln
- 521 Michael Manor
- 917 Tamer Ln
- 3732 Capri Ct Unit T18A
- 3212 Lindenwood Ln
- 2821 Covert Rd
- 713 Greenwood Rd
- 711 Greenwood Rd
- 715 Greenwood Rd
- 716 Glenshire Rd
- 709 Greenwood Rd
- 712 Glenshire Rd
- 714 Glenshire Rd
- 710 Glenshire Rd
- 707 Greenwood Rd
- 3301 Linneman St
- 801 Greenwood Rd
- 708 Glenshire Rd
- 802 Glenshire Rd
- 705 Greenwood Rd
- 3303 Linneman St
- 803 Greenwood Rd
- 706 Glenshire Rd
- 802 Greenwood Rd
- 804 Glenshire Rd
- 703 Greenwood Rd