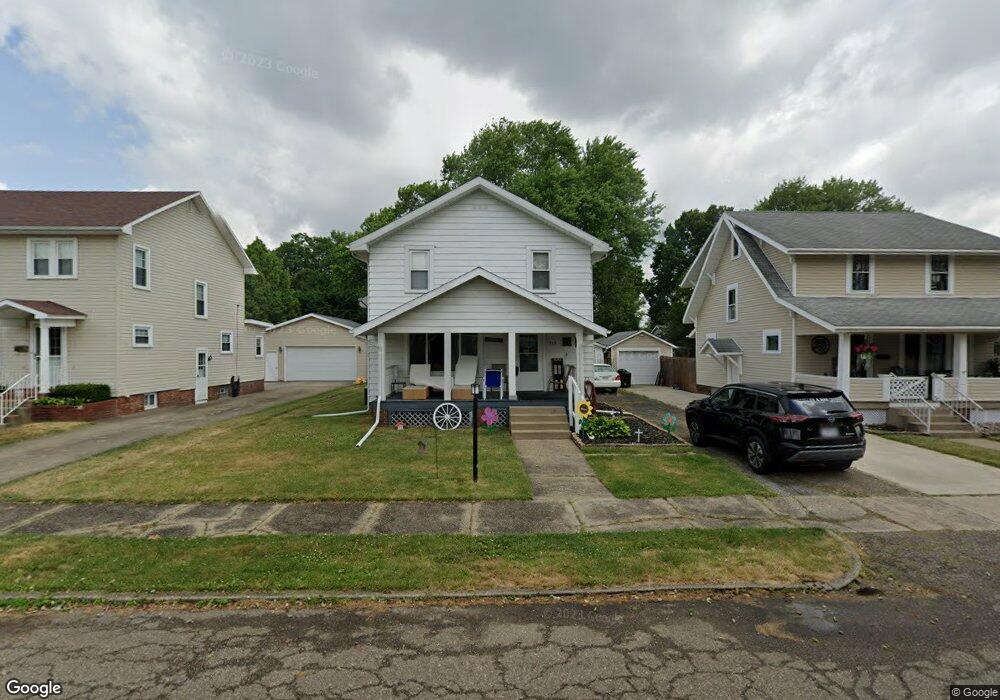
713 Hance Ave NW New Philadelphia, OH 44663
Estimated Value: $174,000 - $222,000
3
Beds
2
Baths
1,714
Sq Ft
$115/Sq Ft
Est. Value
About This Home
This home is located at 713 Hance Ave NW, New Philadelphia, OH 44663 and is currently estimated at $197,608, approximately $115 per square foot. 713 Hance Ave NW is a home located in Tuscarawas County with nearby schools including New Philadelphia High School, Quaker Preparatory Academy, and Quaker Digital Academy.
Ownership History
Date
Name
Owned For
Owner Type
Purchase Details
Closed on
Nov 20, 2023
Sold by
Heidy William E
Bought by
Heidy William E and Heidy Jackie L
Current Estimated Value
Home Financials for this Owner
Home Financials are based on the most recent Mortgage that was taken out on this home.
Original Mortgage
$148,235
Outstanding Balance
$143,368
Interest Rate
4%
Mortgage Type
VA
Estimated Equity
$54,240
Purchase Details
Closed on
Jun 3, 2010
Sold by
Filippi Therese
Bought by
Heidy William E
Home Financials for this Owner
Home Financials are based on the most recent Mortgage that was taken out on this home.
Original Mortgage
$104,193
Interest Rate
5.14%
Mortgage Type
VA
Purchase Details
Closed on
Feb 26, 1990
Sold by
Mccrea Bruce and Mccrea Karen
Bought by
Filippi Douglas E and Filippi Therese
Purchase Details
Closed on
May 9, 1988
Sold by
Dutton Richard M and Dutton Eleanor R
Bought by
Mccrea Bruce and Mccrea Karen
Create a Home Valuation Report for This Property
The Home Valuation Report is an in-depth analysis detailing your home's value as well as a comparison with similar homes in the area
Home Values in the Area
Average Home Value in this Area
Purchase History
| Date | Buyer | Sale Price | Title Company |
|---|---|---|---|
| Heidy William E | -- | Alban Title | |
| Heidy William E | -- | Alban Title | |
| Heidy William E | $102,000 | American Title | |
| Filippi Douglas E | $59,000 | -- | |
| Mccrea Bruce | $54,000 | -- |
Source: Public Records
Mortgage History
| Date | Status | Borrower | Loan Amount |
|---|---|---|---|
| Open | Heidy William E | $148,235 | |
| Closed | Heidy William E | $148,235 | |
| Previous Owner | Heidy William E | $104,193 |
Source: Public Records
Tax History Compared to Growth
Tax History
| Year | Tax Paid | Tax Assessment Tax Assessment Total Assessment is a certain percentage of the fair market value that is determined by local assessors to be the total taxable value of land and additions on the property. | Land | Improvement |
|---|---|---|---|---|
| 2024 | $1,841 | $47,810 | $8,750 | $39,060 |
| 2023 | $1,841 | $136,600 | $25,000 | $111,600 |
| 2022 | $1,854 | $47,810 | $8,750 | $39,060 |
| 2021 | $1,698 | $41,192 | $8,218 | $32,974 |
| 2020 | $1,706 | $41,192 | $8,218 | $32,974 |
| 2019 | $1,705 | $41,192 | $8,218 | $32,974 |
| 2018 | $1,534 | $35,080 | $7,000 | $28,080 |
| 2017 | $1,510 | $35,080 | $7,000 | $28,080 |
| 2016 | $1,544 | $35,080 | $7,000 | $28,080 |
| 2014 | $1,477 | $32,540 | $7,000 | $25,540 |
| 2013 | $1,219 | $32,540 | $7,000 | $25,540 |
Source: Public Records
Map
Nearby Homes
- 836 Miller Ave NW
- 403 5th St NW
- 644 Orchard Ave NW
- 671 Orchard Ave NW
- 402 4th St NW
- 944 Grant Ave NW
- 725 Kaderly St NW
- 825 Zella Ave NW
- 902 W High Ave
- 324 Belmont Ave NW
- 344 Fair Ave NW
- 1063 Grant Ave NW
- 614 10th Dr NW
- 651 Front Ave SW
- 419 3rd St NW
- 1075 Grant Ave NW
- 221 Dale Ln NW
- 514 Front Ave SW
- 250 Ross Ave NW
- 405 Front Ave SW
- 717 Hance Ave NW
- 709 Hance Ave NW
- 703 Hance Ave NW
- 723 Hance Ave NW
- 729 Hance Ave NW
- 710 Park Ave NW
- 720 Park Ave NW
- 712 Hance Ave NW
- 716 Hance Ave NW
- 702 Park Ave NW
- 708 Hance Ave NW
- 706 Hance Ave NW
- 402 6th St NW
- 724 Hance Ave NW
- 412 6th St NW
- 726 Park Ave NW
- 408 6th St NW
- 418 6th St NW
- 360 6th St NW
- 424 6th St NW