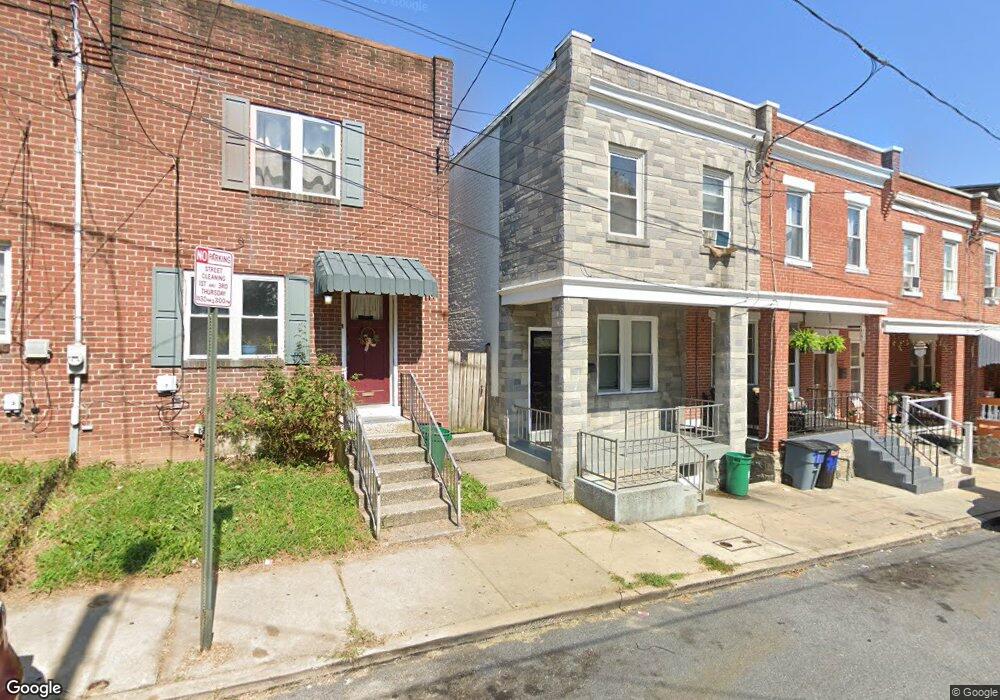
713 High St Lancaster, PA 17603
Cabbage Hill NeighborhoodEstimated Value: $157,000 - $200,000
3
Beds
1
Bath
1,242
Sq Ft
$143/Sq Ft
Est. Value
About This Home
This home is located at 713 High St, Lancaster, PA 17603 and is currently estimated at $177,345, approximately $142 per square foot. 713 High St is a home located in Lancaster County with nearby schools including Lafayette Elementary School, Wheatland Middle School, and McCaskey High School.
Ownership History
Date
Name
Owned For
Owner Type
Purchase Details
Closed on
Apr 26, 2011
Sold by
Deutsche Bank National Trust Co
Bought by
Shah Karishma
Current Estimated Value
Purchase Details
Closed on
Nov 24, 2010
Sold by
Amaro Joel and Amaro Magdaline
Bought by
Deutsche Bank National Trust Company
Purchase Details
Closed on
Oct 23, 2006
Sold by
Amaro Magdaline and Amaro Joel
Bought by
Amaro Joel and Amaro Magdaline
Home Financials for this Owner
Home Financials are based on the most recent Mortgage that was taken out on this home.
Original Mortgage
$64,000
Interest Rate
10.7%
Mortgage Type
New Conventional
Create a Home Valuation Report for This Property
The Home Valuation Report is an in-depth analysis detailing your home's value as well as a comparison with similar homes in the area
Home Values in the Area
Average Home Value in this Area
Purchase History
| Date | Buyer | Sale Price | Title Company |
|---|---|---|---|
| Shah Karishma | $33,299 | None Available | |
| Deutsche Bank National Trust Company | -- | None Available | |
| Amaro Joel | -- | None Available |
Source: Public Records
Mortgage History
| Date | Status | Borrower | Loan Amount |
|---|---|---|---|
| Previous Owner | Amaro Joel | $64,000 |
Source: Public Records
Tax History Compared to Growth
Tax History
| Year | Tax Paid | Tax Assessment Tax Assessment Total Assessment is a certain percentage of the fair market value that is determined by local assessors to be the total taxable value of land and additions on the property. | Land | Improvement |
|---|---|---|---|---|
| 2025 | $2,255 | $57,000 | $10,700 | $46,300 |
| 2024 | $2,255 | $57,000 | $10,700 | $46,300 |
| 2023 | $2,218 | $57,000 | $10,700 | $46,300 |
| 2022 | $2,125 | $57,000 | $10,700 | $46,300 |
| 2021 | $2,080 | $57,000 | $10,700 | $46,300 |
| 2020 | $2,080 | $57,000 | $10,700 | $46,300 |
| 2019 | $2,048 | $57,000 | $10,700 | $46,300 |
| 2018 | $1,216 | $57,000 | $10,700 | $46,300 |
| 2017 | $2,177 | $47,400 | $12,900 | $34,500 |
| 2016 | $2,157 | $47,400 | $12,900 | $34,500 |
| 2015 | $842 | $47,400 | $12,900 | $34,500 |
| 2014 | $1,883 | $47,400 | $12,900 | $34,500 |
Source: Public Records
Map
Nearby Homes