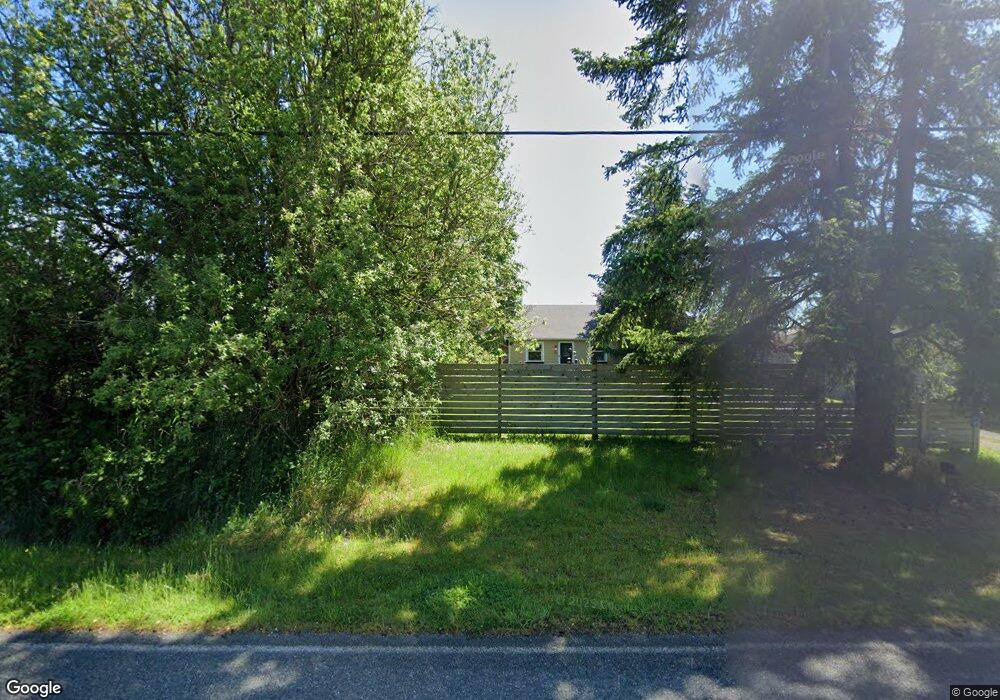
713 Kelly Rd Bellingham, WA 98226
Estimated Value: $689,000 - $857,572
2
Beds
3
Baths
1,626
Sq Ft
$477/Sq Ft
Est. Value
About This Home
This home is located at 713 Kelly Rd, Bellingham, WA 98226 and is currently estimated at $775,393, approximately $476 per square foot. 713 Kelly Rd is a home located in Whatcom County with nearby schools including Irene Reither Elementary School, Meridian Middle School, and Meridian High School.
Ownership History
Date
Name
Owned For
Owner Type
Purchase Details
Closed on
Oct 13, 2015
Sold by
Henry Loren Ward
Bought by
Henry Rebecca Lauren
Current Estimated Value
Purchase Details
Closed on
Feb 9, 2007
Sold by
Whitman D Mitchell and Whitman Jill S
Bought by
Henry Loren W and Henry Rebecca L
Home Financials for this Owner
Home Financials are based on the most recent Mortgage that was taken out on this home.
Original Mortgage
$150,000
Outstanding Balance
$89,993
Interest Rate
6.19%
Mortgage Type
Purchase Money Mortgage
Estimated Equity
$685,400
Purchase Details
Closed on
Nov 21, 2001
Sold by
Mcabee Tim E and Mcabee Nancy L
Bought by
Whitman D Mitchell and Whitman Jill S
Home Financials for this Owner
Home Financials are based on the most recent Mortgage that was taken out on this home.
Original Mortgage
$112,800
Interest Rate
5.75%
Create a Home Valuation Report for This Property
The Home Valuation Report is an in-depth analysis detailing your home's value as well as a comparison with similar homes in the area
Home Values in the Area
Average Home Value in this Area
Purchase History
| Date | Buyer | Sale Price | Title Company |
|---|---|---|---|
| Henry Rebecca Lauren | -- | None Available | |
| Henry Loren W | $459,280 | Whatcom Land Title | |
| Whitman D Mitchell | $121,196 | Whatcom Land Title |
Source: Public Records
Mortgage History
| Date | Status | Borrower | Loan Amount |
|---|---|---|---|
| Open | Henry Loren W | $150,000 | |
| Previous Owner | Whitman D Mitchell | $112,800 |
Source: Public Records
Tax History Compared to Growth
Tax History
| Year | Tax Paid | Tax Assessment Tax Assessment Total Assessment is a certain percentage of the fair market value that is determined by local assessors to be the total taxable value of land and additions on the property. | Land | Improvement |
|---|---|---|---|---|
| 2024 | $6,488 | $817,220 | $251,520 | $565,700 |
| 2023 | $6,488 | $798,870 | $245,873 | $552,997 |
| 2022 | $5,173 | $629,031 | $193,600 | $435,431 |
| 2021 | $4,795 | $519,860 | $160,000 | $359,860 |
| 2020 | $4,399 | $441,660 | $144,986 | $296,674 |
| 2019 | $3,485 | $403,336 | $132,405 | $270,931 |
| 2018 | $4,238 | $353,103 | $115,915 | $237,188 |
| 2017 | $3,827 | $325,623 | $106,894 | $218,729 |
| 2016 | $3,697 | $309,667 | $101,656 | $208,011 |
| 2015 | $3,615 | $295,484 | $97,000 | $198,484 |
| 2014 | -- | $280,243 | $110,845 | $169,398 |
| 2013 | -- | $285,233 | $112,800 | $172,433 |
Source: Public Records
Map
Nearby Homes
- 1041 Sterk Ln
- 4935 E 3rd Dr
- 626 van Wyck Rd
- 4645 Vining Rd
- 858 E Smith Rd
- 504 E Smith Rd
- 562 E Smith Rd
- 4355 Gooding Ave
- 4417 Blackstone Way
- 4682 Guide Meridian
- 4866 Guide Meridian
- 4326 Foothills Ct
- 0 van Wyck Ln
- 4324 Winslow Ct
- 4316 Winslow Ct
- 4292 King Mountain Rd
- 5140 Guide Meridian
- 571 Creston Ct
- 4302 Creston Way
- 4300 Creston Way